Appendix (Thailand)
1 Inputs
1.1 Socioeconomics
1.1.1 Population
Historical Trends
Thailand’s National Economic and Social Development Board (NESDB) and Department of Provincial Administration (DOPA) have reported annual population both nationally and by province from 1990 to 2020. The plot below shows national population, revealing a consistent upward trend.
**](thailand_appendix_files/figure-html/recent%20national%20trends%20pop-1.png)
Figure 9.1.1.1 Thailand National Population from 2011 to 2020. Source: NESDB
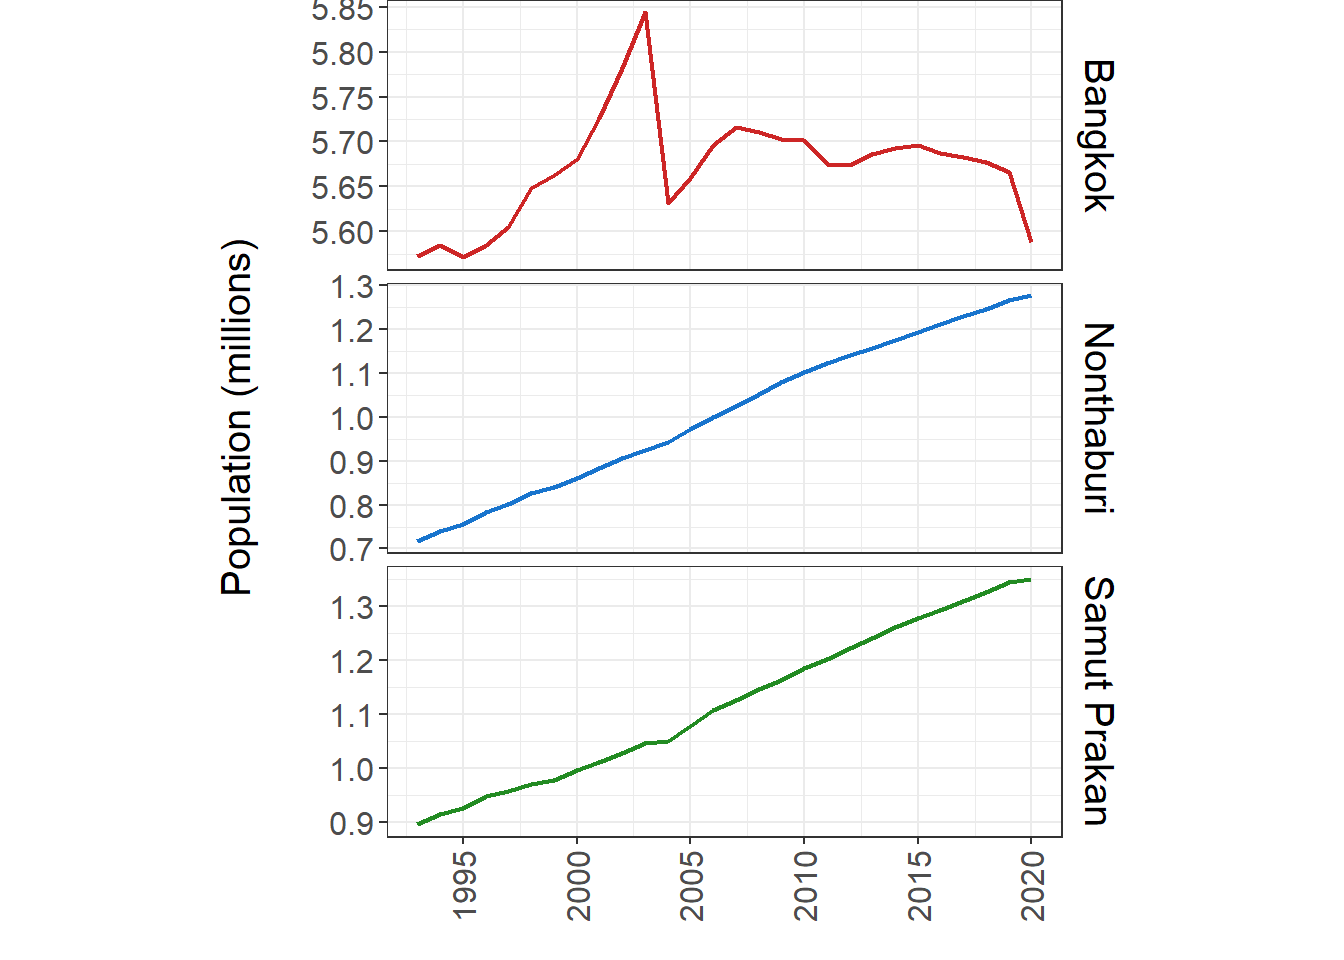
Of the three provinces in MEA’s service area (Bangkok, Nonthaburi, and Samut Prakan), Bangkok has the highest population. Between 1990 and 2020, population increased steadily in Nonthaburi and Samut Prakan, reaching nearly 1.3 million in Nonthaburi and 1.35 million in Samut Prakan. Meanwhile, Bangkok’s population showed much more variation, reaching its peak at almost 5.85 million in 2003 and declining to under 5.6 million in 2020.
**](images/half_blank_space.jpg)
Figure 9.1.1.2. Population from 1990 to 2020 in the MEA service area. Source: DOPA
1.1.2 GDP (THB)
The plots below show GDP and Gross Provincial Product (GPP; analagous to GDP at the provincial scale) in units of Thai Baht at current prices for each year. See appendix for plots showing GDP and per capita GDP at constant prices (2005 $USD), which are the untis accepted by GCAM.
Historical Trends
Thailand’s National Economic and Social Development Board (NESDB) has reported both annual GDP from 1990 to 2020 and annual GPP from 1995 to 2020. The plots below show GDP and GPP at current market prices during these periods.
**](thailand_appendix_files/figure-html/historical%20national%20trends%20gdp-1.png)
Figure 9.1.2.1. Thailand national GDP from 1990 to 2020 at current market prices. Source: NESDB
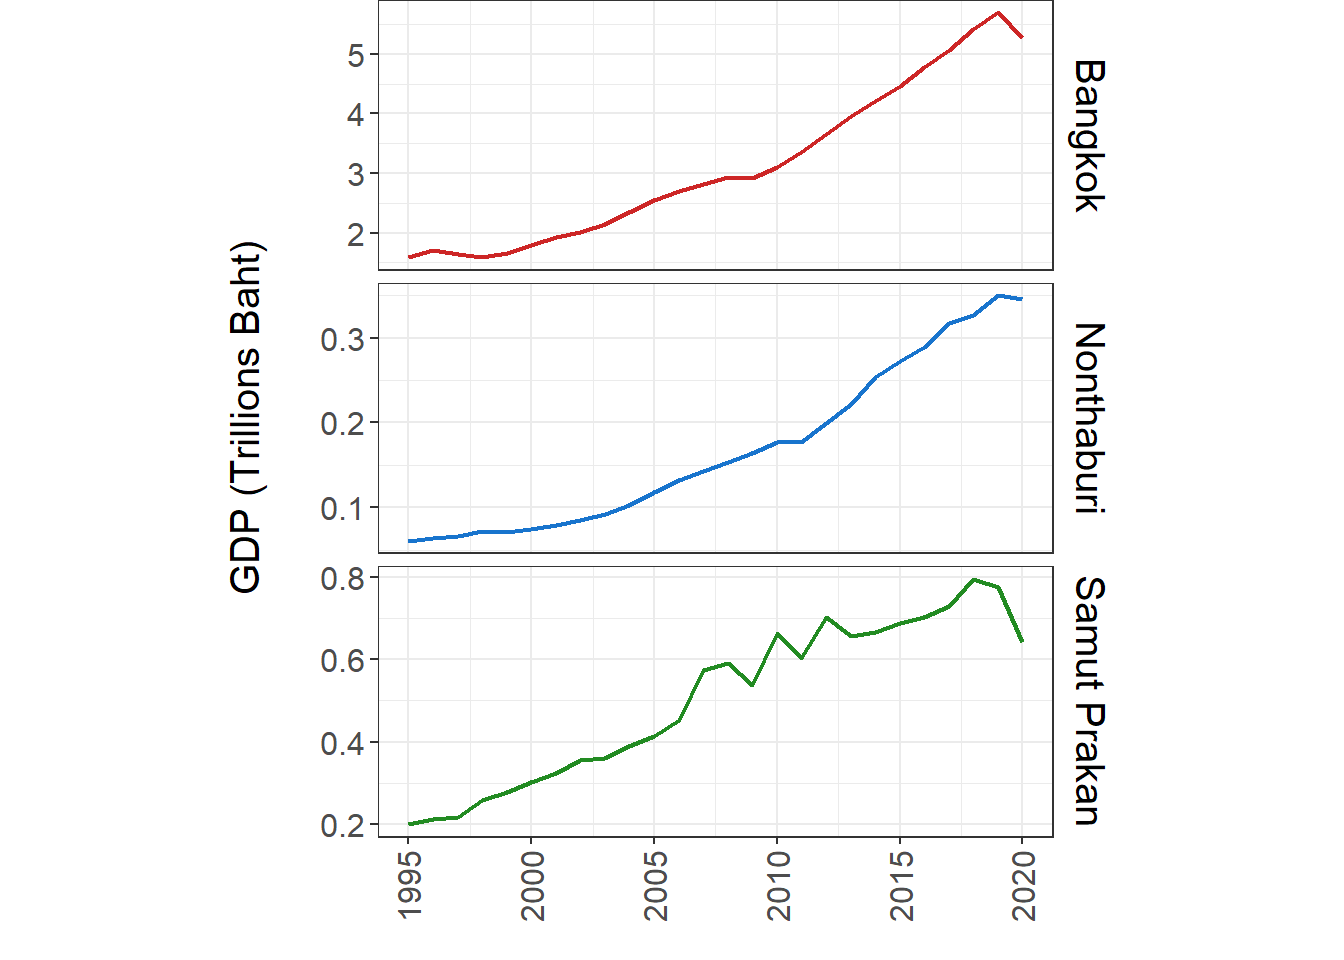
Of the three MEA provinces, Bangkok had the highest GDP in 2020, reaching over 5 trillion Baht. Samut Prakan had the next highest GDP of about 650 million Baht, while Nonthaburi’s GDP was about 350 million Baht. All three provinces experienced relatively consistent GDP growth in the period from 2010 to 2019.
Figure 9.1.2.2. GPP from 1995 to 2020 in the MEA service area at current market prices. Source: NESDB
Future Projections
To project future GDP and GPP, we used a combination of NESDB projections and other assumptions. For GDP, NESDB has provided a projection through 2050 in Thailand’s Long Term Plan (LTP). Beyond 2050, we made an assumption that per capita GDP would reach 52,000 USD (at the 2005 price) by 2100 based on historical trajectories of several developed countries. We assumed that GPP future trajectories would vary between provinces, with Bangkok’s per capita GDP reaching around 70,000 USD (at the 2005 price) by 2100, consistent with income ranges of some high income cities at present. The plots below show estimated GDP and GPP in THB from 2021 to 2100 based on these assumptions, as well as GDP/GPP growth rates during this period.
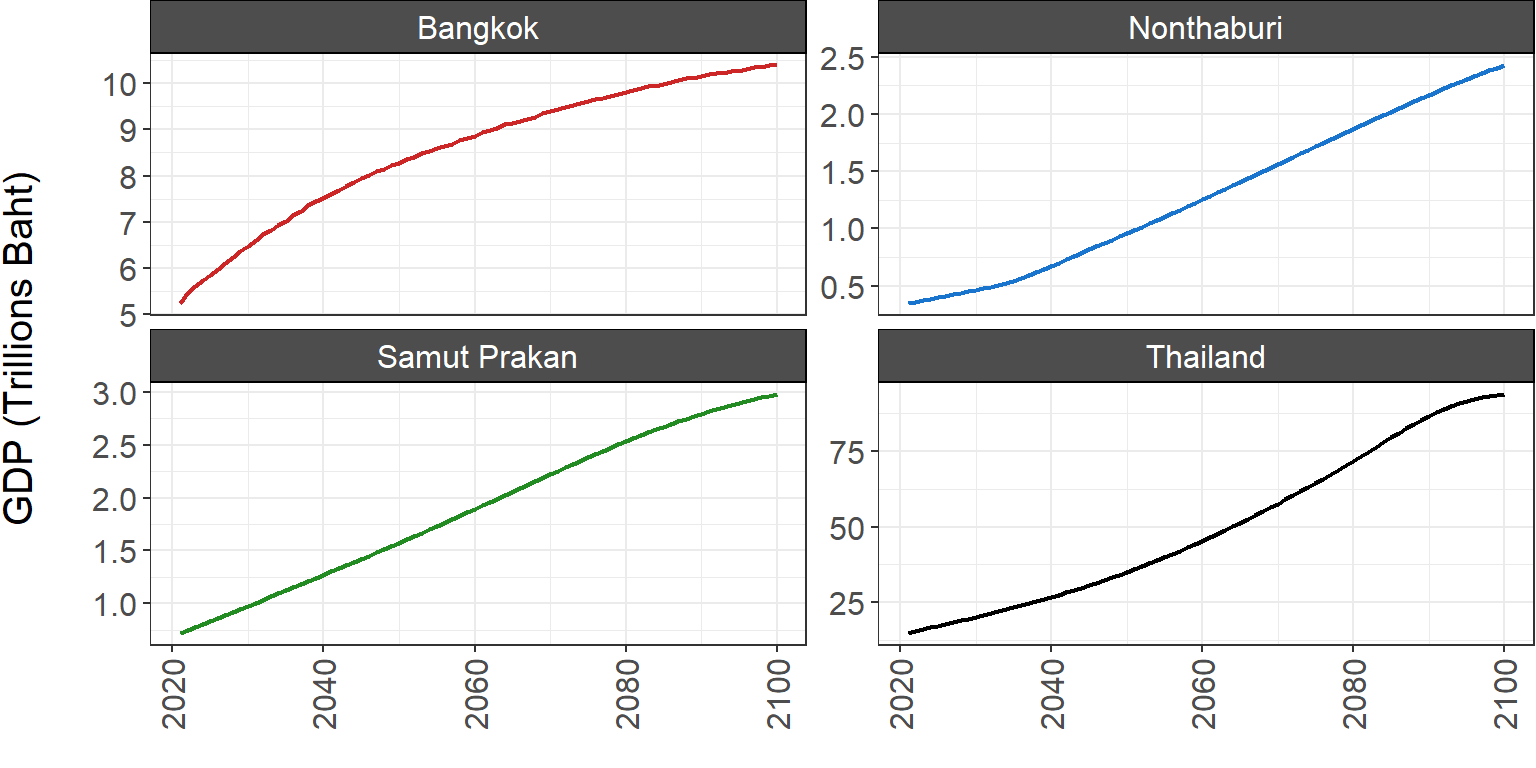
Figure 9.1.2.3. Projected future GDP in Thailand and GPP in the MEA provinces.
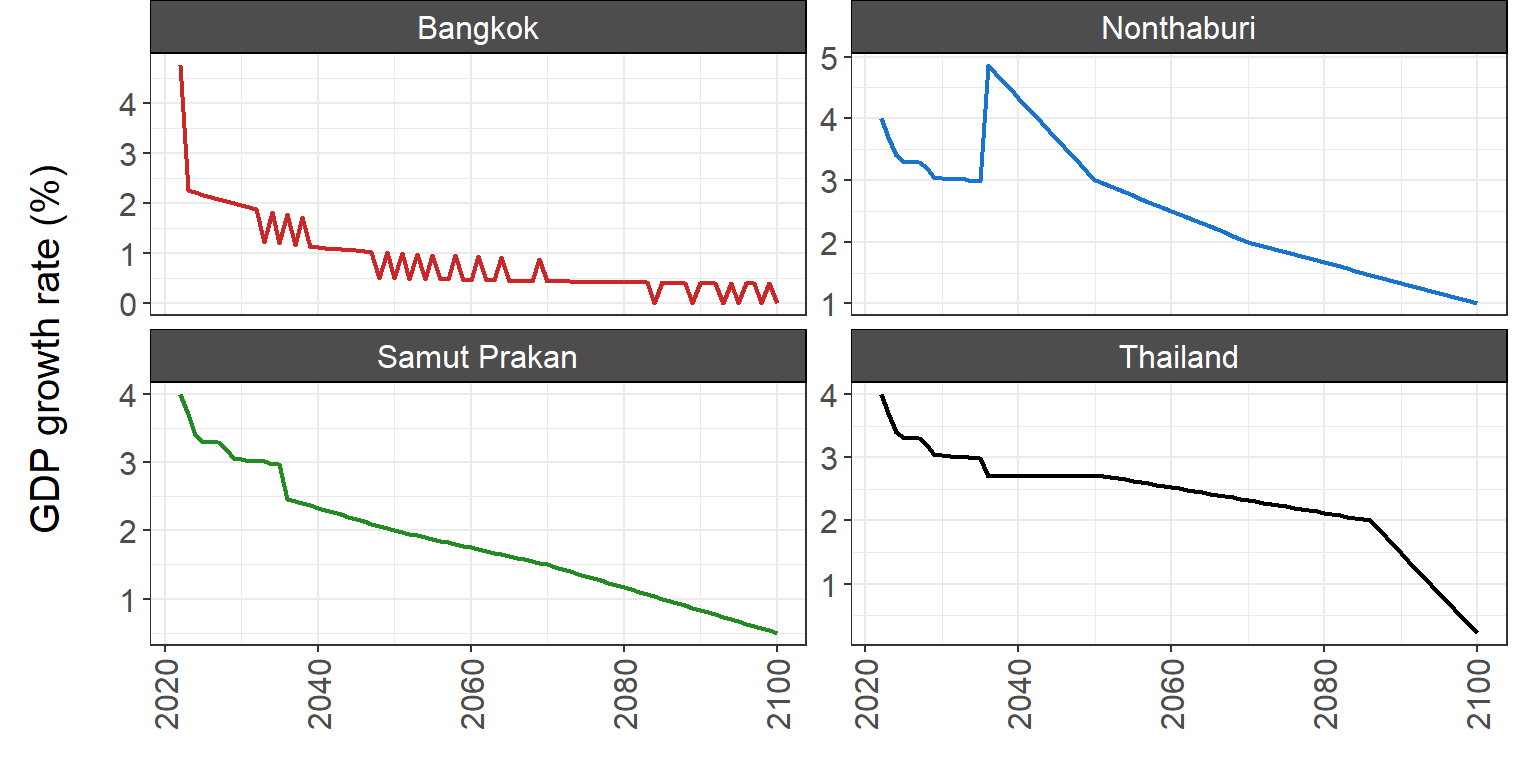
Figure 9.1.2.4. Projected future growth rates of GDP in Thailand and GPP in the MEA provinces.
1.1.3 Per Capita GDP (THB)
Historical Trends
The plots below shows Thailand’s historical per capita GDP from 1990 to 2020.
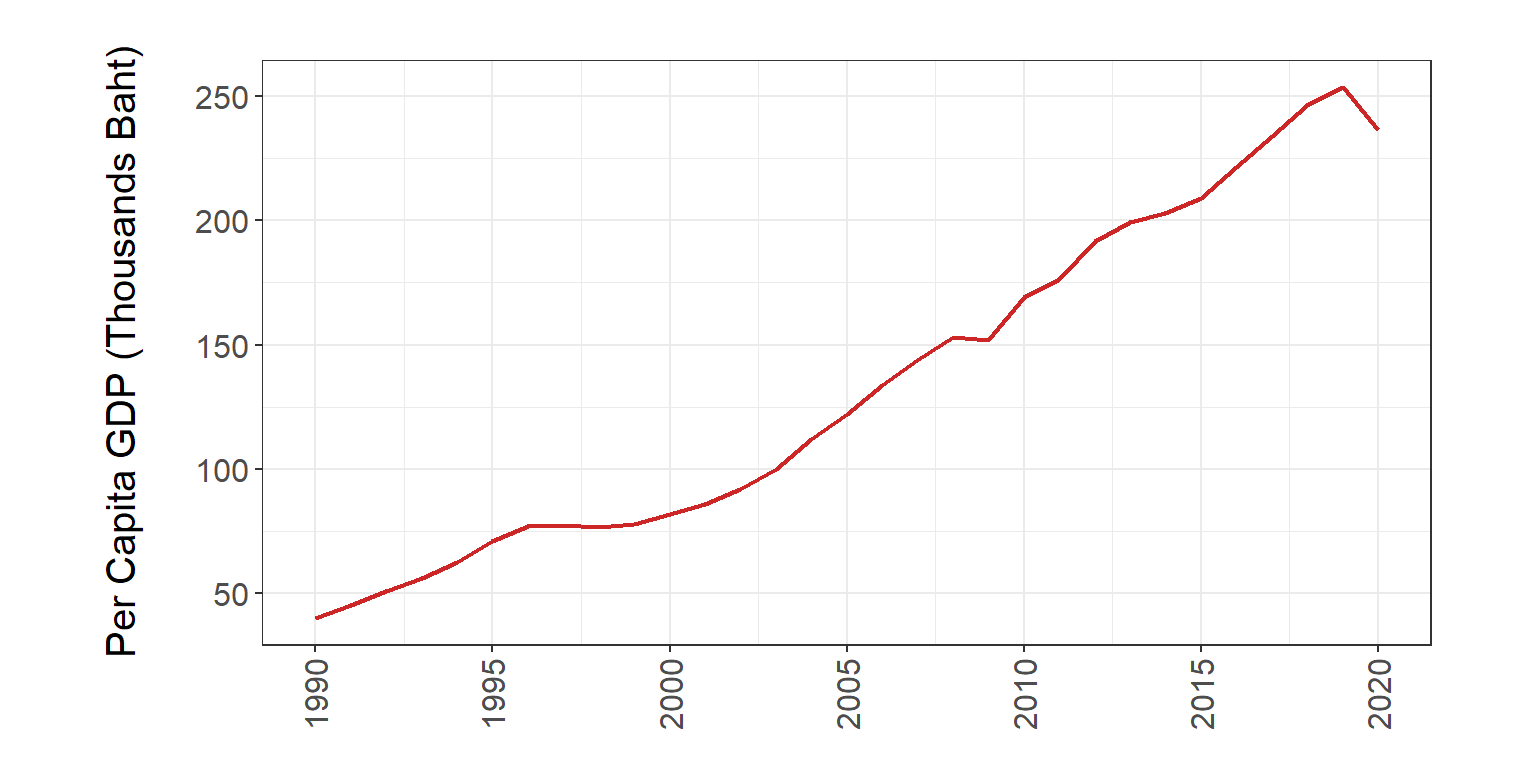
Figure 9.1.3.1. Per capita GDP from 1990 to 2019 at current market prices.
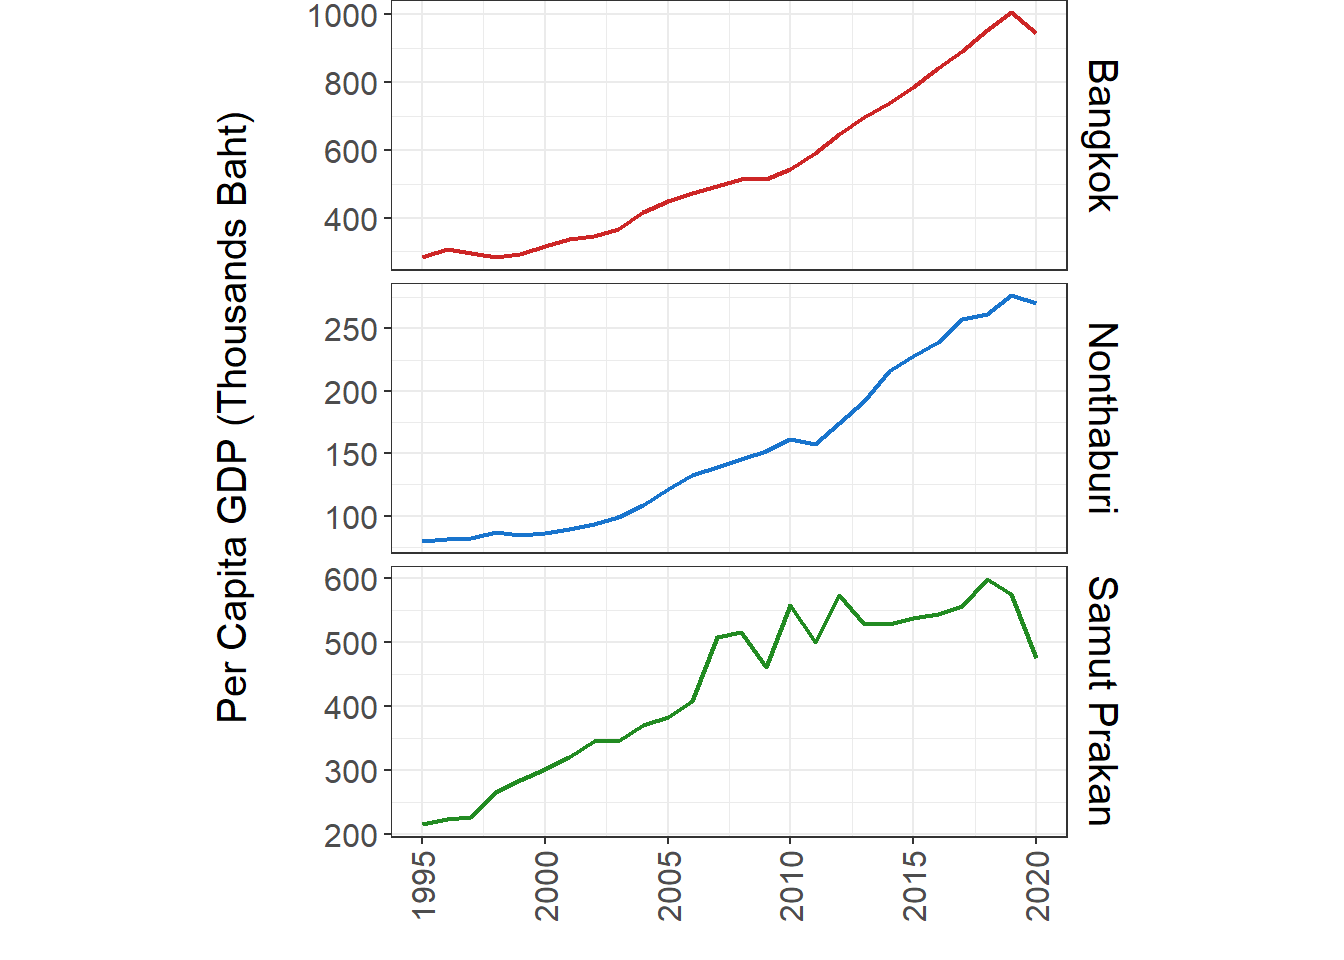 These plots show per capita GDP in the three MEA provinces during the
same period.
These plots show per capita GDP in the three MEA provinces during the
same period.
Figure 9.1.3.2. GPP from 1995 to 2020 in the MEA service area provinces at current market prices.
Future Projections
The plot below shows per capita GDP/GPP (THB) and growth rates from 1990 to 2100 for each region.
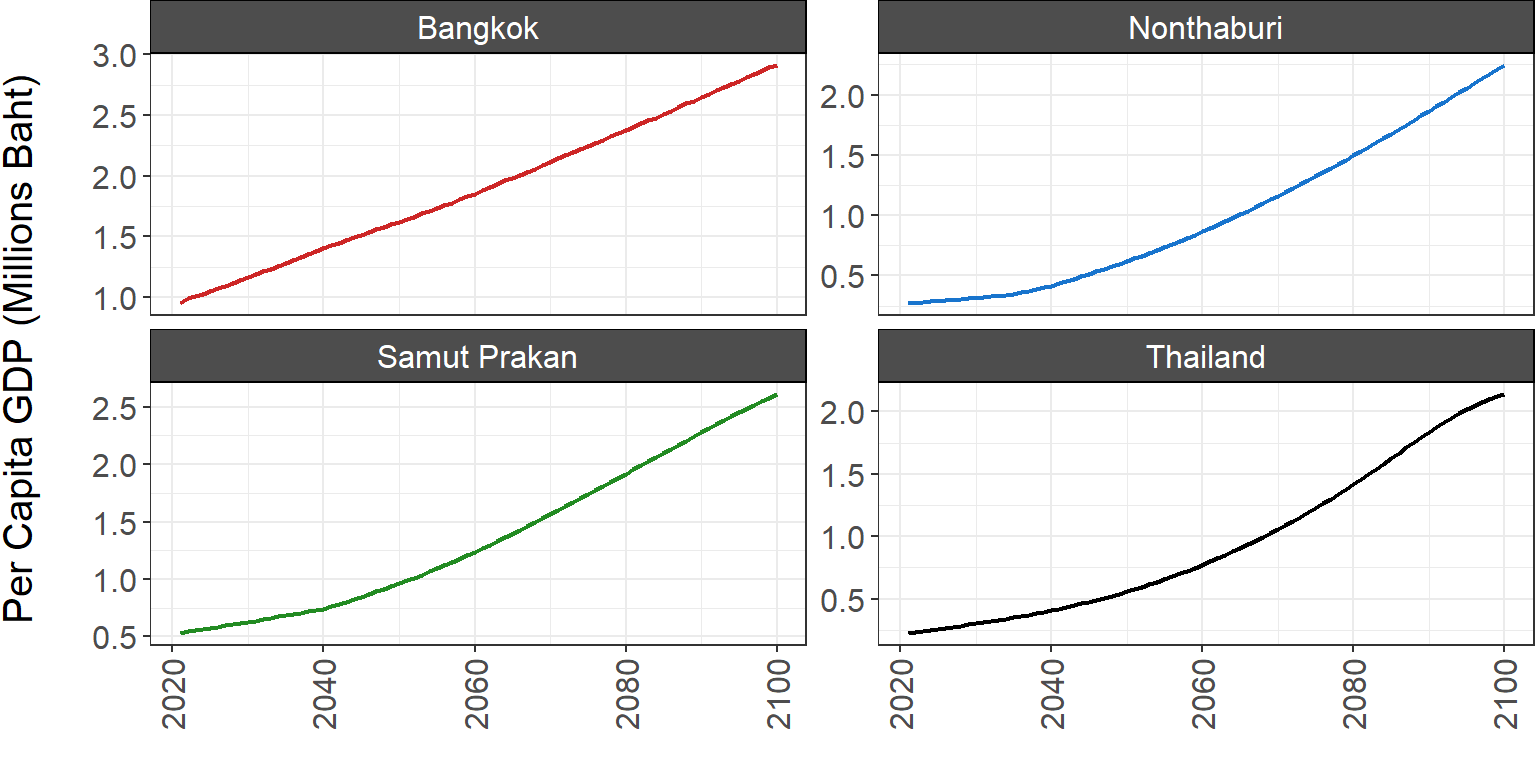
Figure 9.1.3.3. Per capita GDP/GPP through 2100 in each region
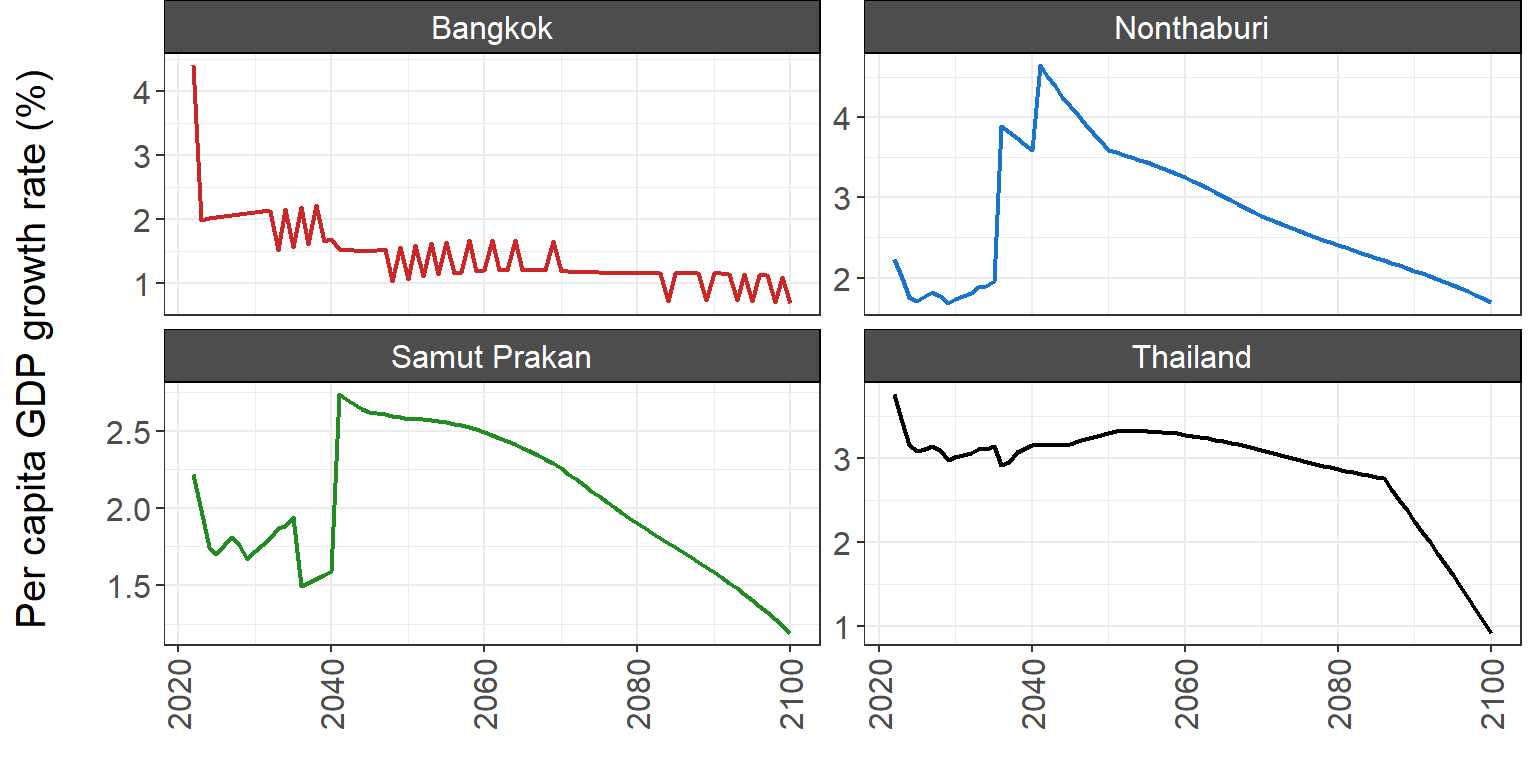
Figure 9.1.3.4. Projected future growth rates of per capita GDP in Thailand and per capita GPP in the MEA provinces.
Per Capita GDP
Recent Trends
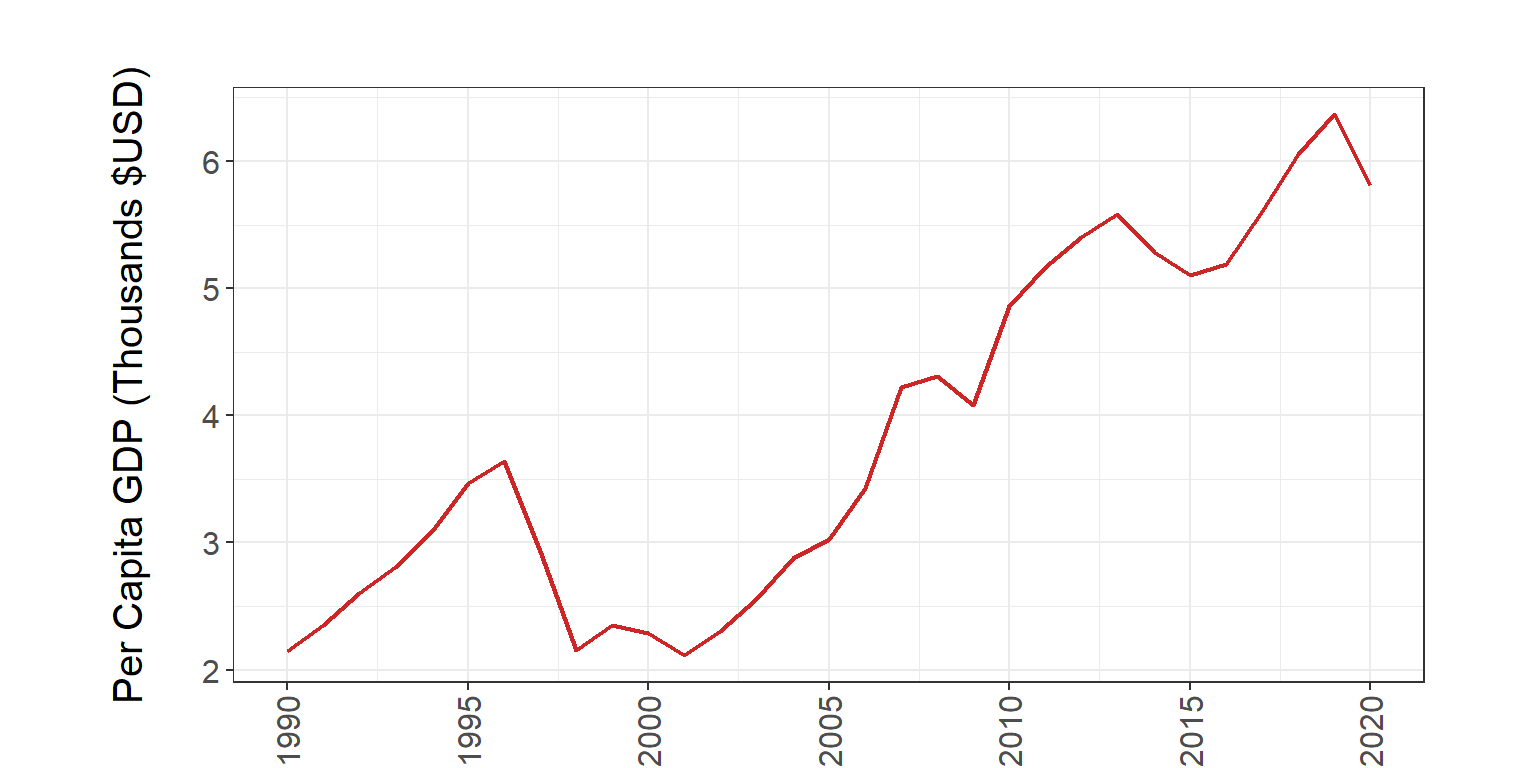
Figure A1.1.4. Thailand per capita GDP from 1990 to 2020 in constant 2005 $USD
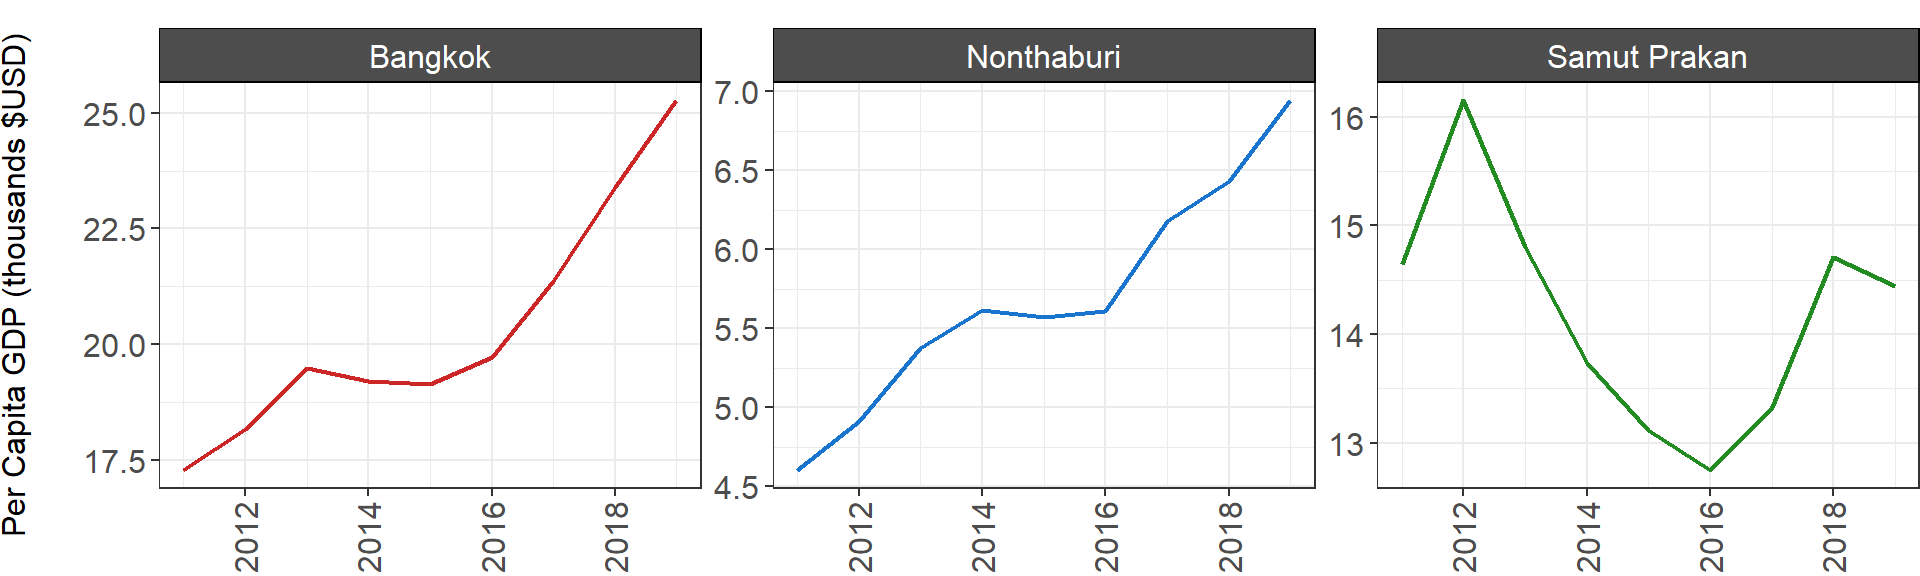
Figure A1.1.5. GPP from 1995 to 2020 in the MEA service area in constant 2005 $USD.
1.2 Adjustments to socioeconomic inputs
PNNL presented their socioeconomic input data and assumptions for Thailand and the MEA provinces to the Thammasat team for feedback. The Thammasat team provided a set of revised data based on different sources and assumptions. The following section documents the original and revised data.
1.2.1 Original data
Our original data sources and assumptions for socioeconomic inputs are shown in the table below.
| Variable | Assumptions | Data Sources |
|---|---|---|
| Population | Pre-2010 and post-2019 population growth rates are consistent between all regions |
- All regions 2010-2019: National
Statistical Office - Pre-2010 & post-2020 growth rates: United Nations |
| GDP | Pre-2011 and post-2020 GDP growth rates are consistent between all regions |
- All regions 2011-2020: National
Statistical Office - Pre-2011 growth rates:World Bank - 2021-2037 growth rates: PDP2018 - USD-THB exchange rates: FRED |
| Post-2037 GDP growth rate is constant |
Using these sources and assumptions, we compiled the following population and GDP estimates for Thailand and the three MEA provinces. In these charts, the grey shaded areas represent data reported by the National Statistical Office.
Population
(2011-2020) and [United Nations](https://population.un.org/wpp/Graphs/1_Demographic%20Profiles/Thailand.pdf) (Pre-2011 and post-2020)**](thailand_appendix_files/figure-html/historical%20&%20future%20trends%20pop%20appendix-1.png)
Figure A.1.2.1.1. Historical and projected future population in Thailand and MEA area. Sources: National Statistical Office(2011-2020) and United Nations (Pre-2011 and post-2020)
GDP
 (2010-2019), [World Bank](https://data.worldbank.org/indicator/NY.GDP.MKTP.CD?locations=TH) (Pre-2010) and [PDP2018](https://www.thaienergy.org/assets/files/pdp2018-pdf.pdf) (Post-2020)**](thailand_appendix_files/figure-html/historical%20&%20future%20trends%20gdp%20baht%20appendix-1.png)
Figure A1.2.1.2. Historical and projected future GDP in Thailand and MEA area. Sources: National Statistical Office (2010-2019), World Bank (Pre-2010) and PDP2018 (Post-2020)
Per Capita GDP
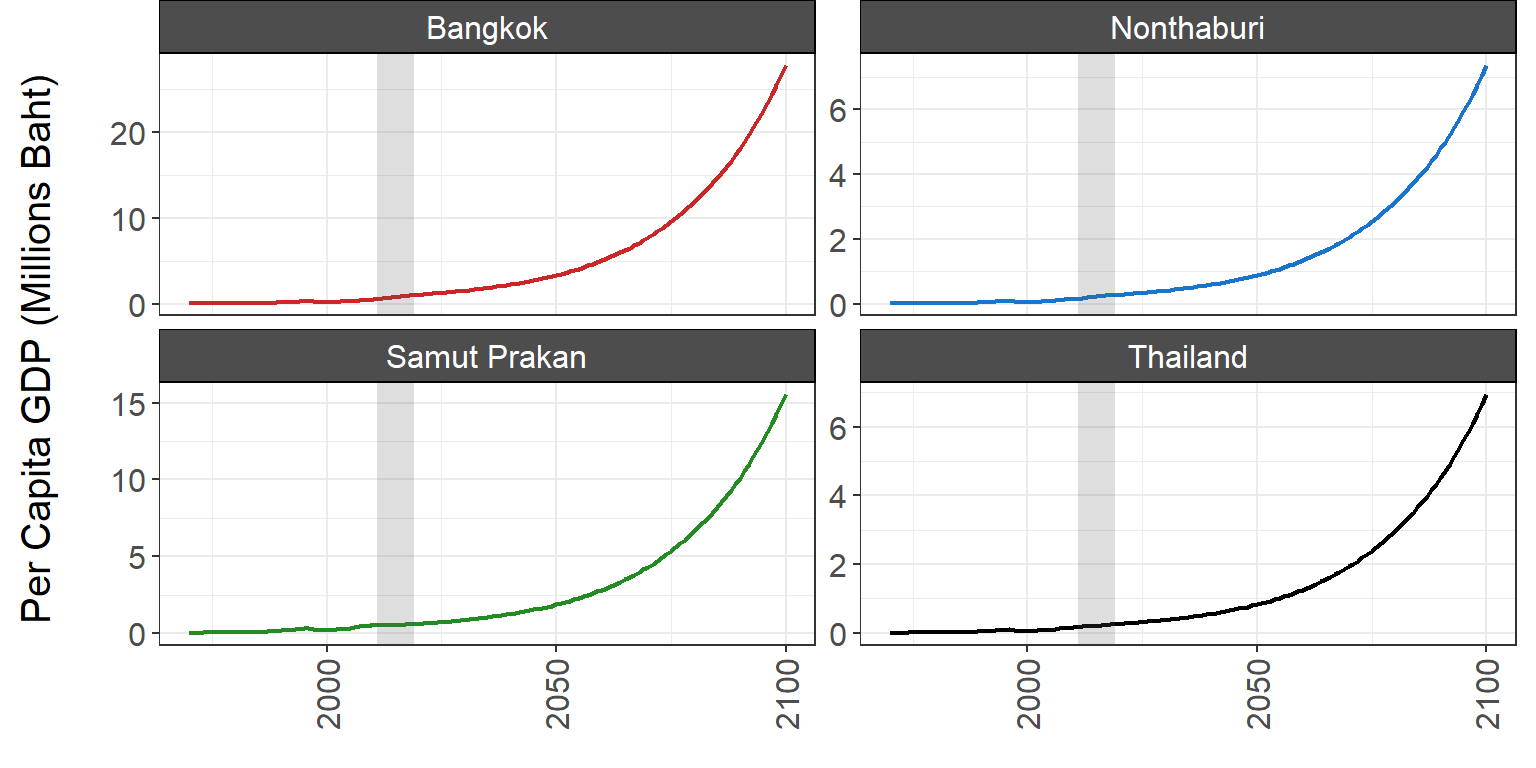
Figure A1.2.1.3. Per capita GDP through 2100 in each region
1.2.2 Revised Data
Below are the revised data sources and assumptions for population and GDP data provided by the Thammasat University team:
| Variable | Region | Data Sources | Assumptions |
|---|---|---|---|
| Population | National |
- Historical (1993-2021): National
Economic & Social Development Board (NESDB) - Projected (2022-2040): NESDB - Projected (2041-2100): United Nations (UN) |
2041-2100 projection is from UN’s medium growth scenario. |
| Provincial |
- Historical (1993-2021): Department
of Provincial Administration - Projected (2022-2040): NESDB |
Post-2040 projections are based on shares of national population in 2040 (Bangkok: 8.1%; Nonthaburi: 2.5%; Samut Prakan: 2.6%). | |
| GDP/GPP | National |
- Historical (1990-2020): NESDB
- Historical (2020-2021):Nikkei Asia article - Projected (2021-2050): missing link (NESDB) |
Post-2050 national GDP projections follow assumption that GDP will be around 52,000 USD (2005) based on historical GDP per capita trends of developed nations. |
| Provincial | Historical (1995-2020): NESDB | GPP assumptions for 2021-2100 vary between provinces, with Bangkok’s per capita GDP reaching around 70,000 USD (2005) by 2100, consistent with income ranges of some high income cities at present. |
The following charts compare the data compiled from these revised sources and assumptions with those compiled from our original sources and assumptions.
Population
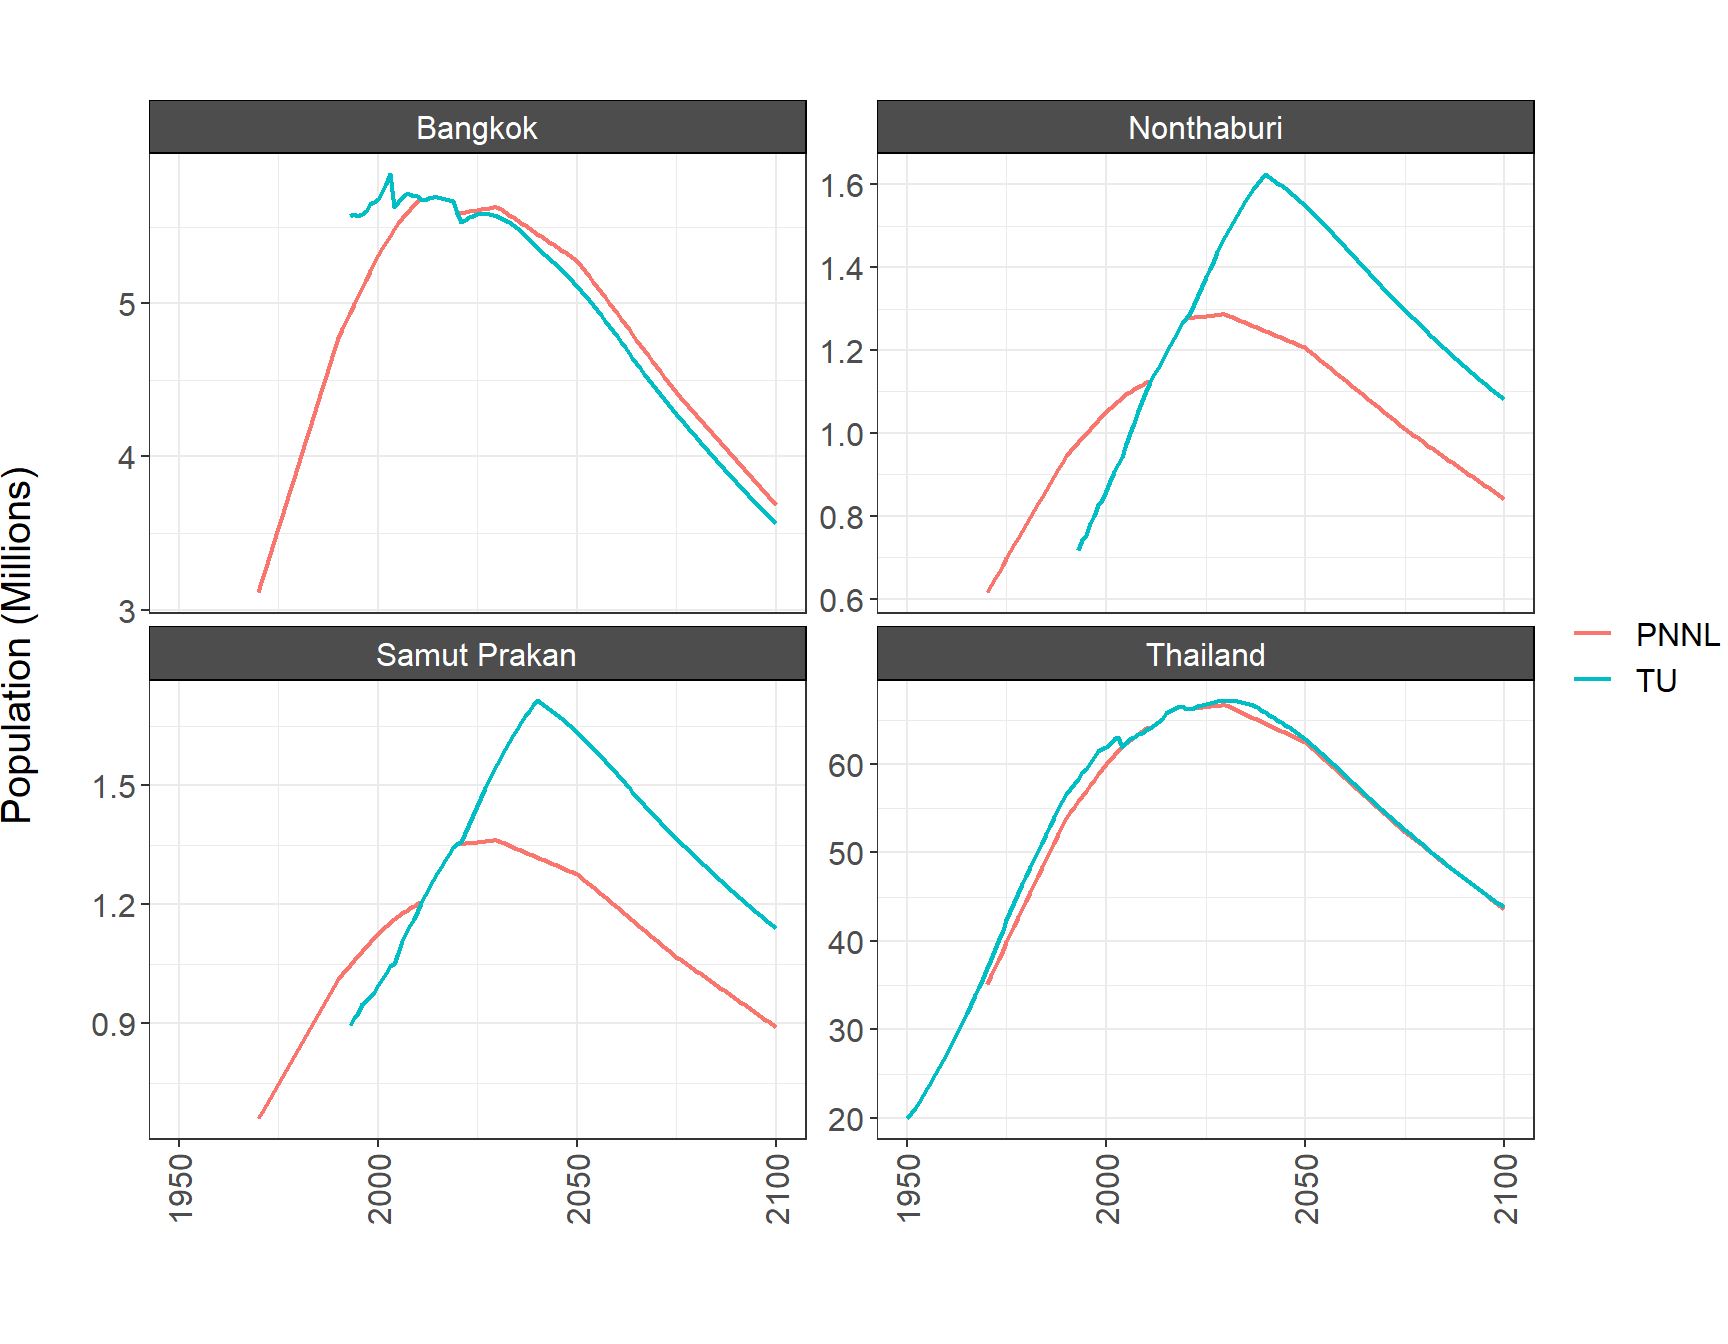
Figure A1.2.2.1. Comparison of population data from original (PNNL) and revised (TU) sources and assumptions.
GDP
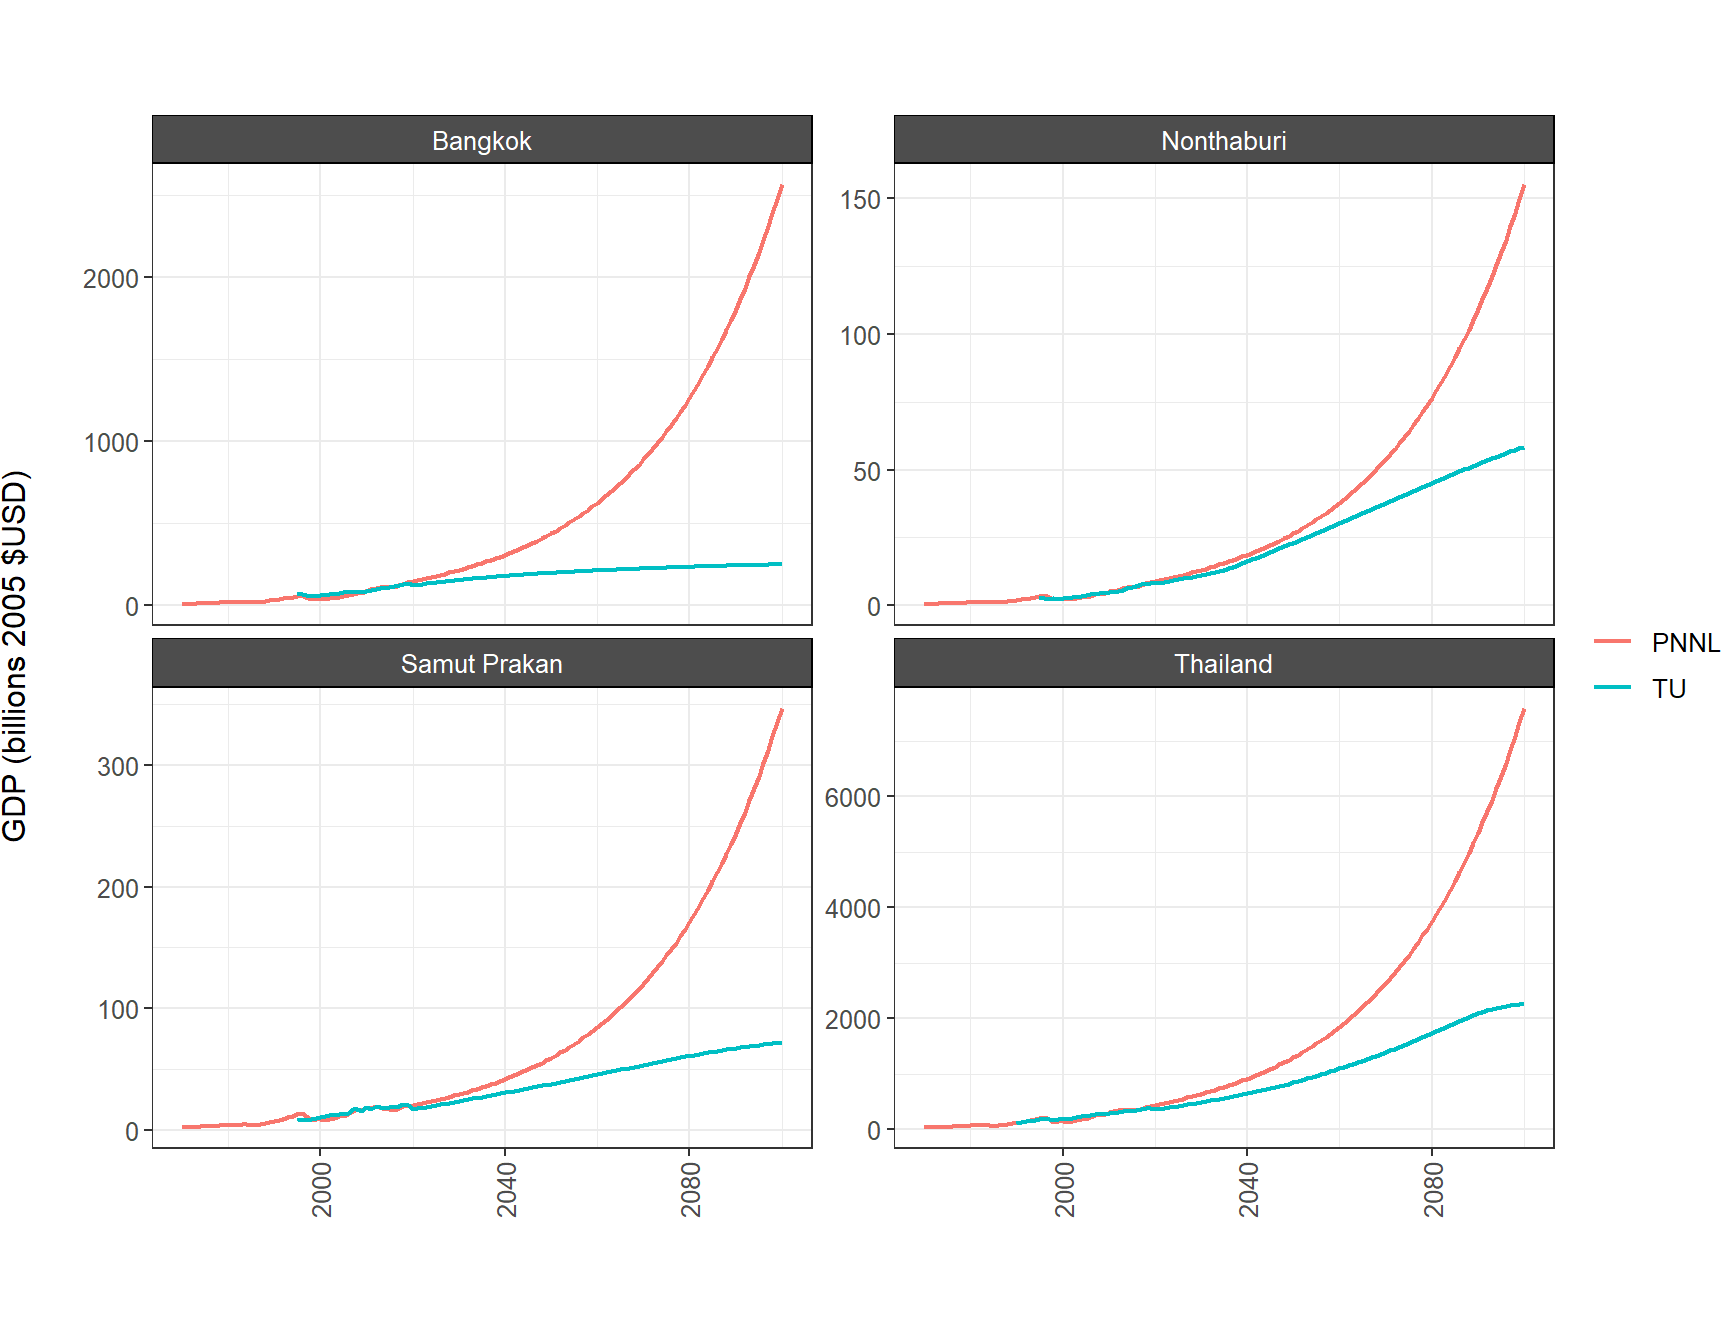
Figure A1.2.2.2. Comparison of GDP data from original (PNNL) and revised (TU) sources and assumptions.
Per capita GDP
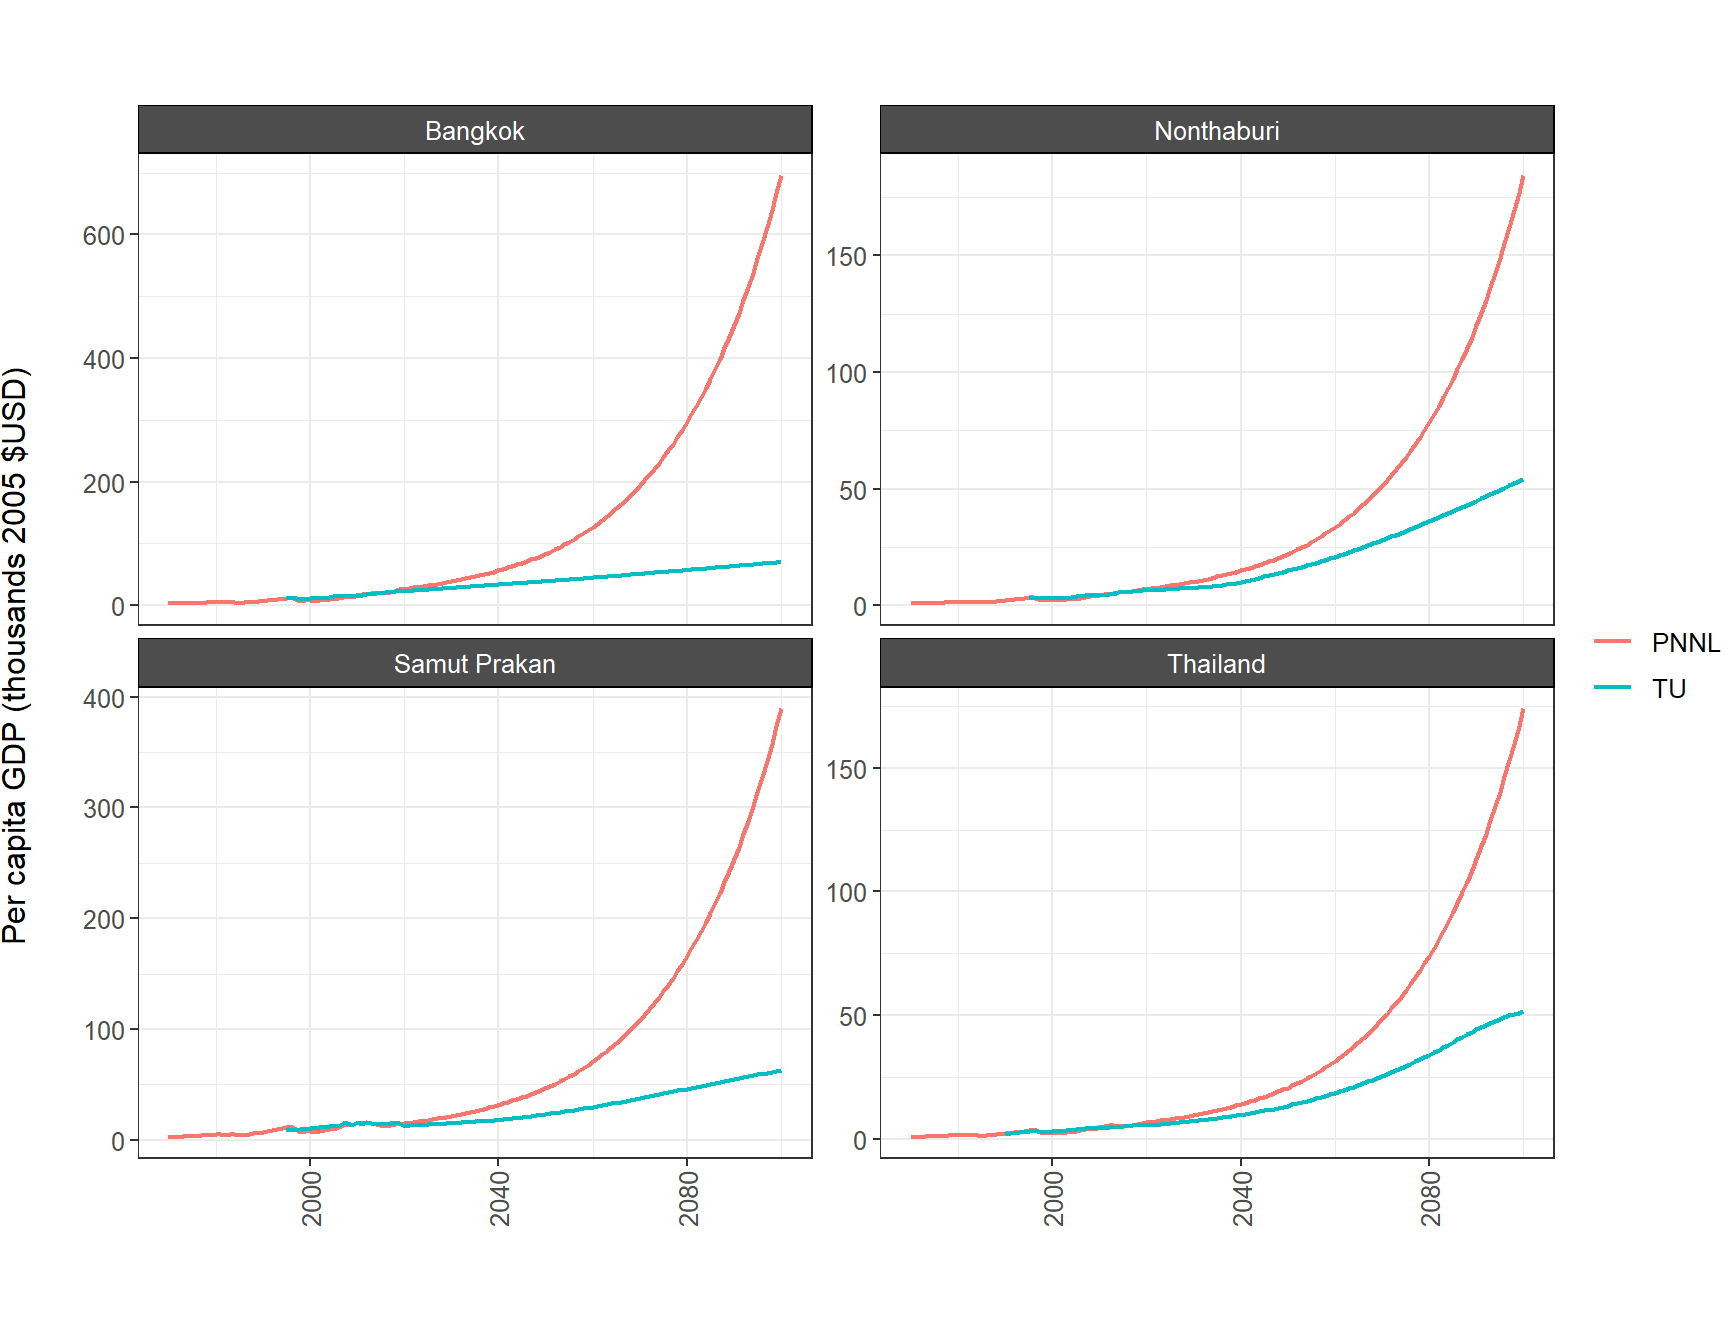
Figure A1.2.2.3. Comparison of per capita GDP data from original (PNNL) and revised (TU) sources and assumptions.
2 References
2.1 Local Data
Socioeconomics
- Historical national population (1990-2020): National Economic and Social Development Board (NESDB)
- Historical provincial population (1990-2020): Department of Provincial Administration
- National and provincial population projection (2021-2040) NESDB
- National population Projection (2041-2100): United Nations
- Historical GDP and GPP (1990-2019): NESDB
Electricity
- Electricity consumption: Energy Policy and Planning Office
Energy
- Energy consumption: Energy Policy and Planning Office
Emissions
- CO2 emissions: Energy Policy and Planning Office
WORK IN PROGRESS
- DO NOT CITE
![]()
![]()
![]()
![]()