4. Visualizing outcomes#
Methods for communicating outcomes of large ensemble analyses can vary depending on the intended audience, but the general challenges faced are not unique to this research space. As an exploratory approach, one should consider the purpose of the results in spurring further research (emphasizing technical depth of uncertainty characterization) or aiding in decision making (providing accessible and actionable insights from potentially esoteric model abstractions). However, as is often the case with multisectoral modeling, specific components of results are always positioned within a broader context, adding inherent layers to the discussion of any model outputs. This is of course compounded by the number of model realizations in an ensemble, which adds an additional dimension to visualizations.
Running a large and complicated model many times makes it impossible to contain every relevant attribute of the data for every realization in the ensemble in a single plot. Common visualization techniques for multi-dimensional data such as parallel axis plots can be effective for conveying insights, but can still be limited by the number of realizations that can be shown without resorting to multiple panels. This is a common tradeoff which can quickly lead to overloaded and “busy” figures which are inaccessible to stakeholders or non-modelers. This can become a limiting factor when time and/or space are limited to communicate outcomes. Indeed, a main tenet of scenario discovery is the dimensionality reduction achieved when more fully characterizing a wide uncertainty space and identifying an interpretable set of key drivers or scenario typologies. In short, balancing simplicity and interpretability with rigorousness and robustness is a crucial tradeoff when sharing results from large ensembles.
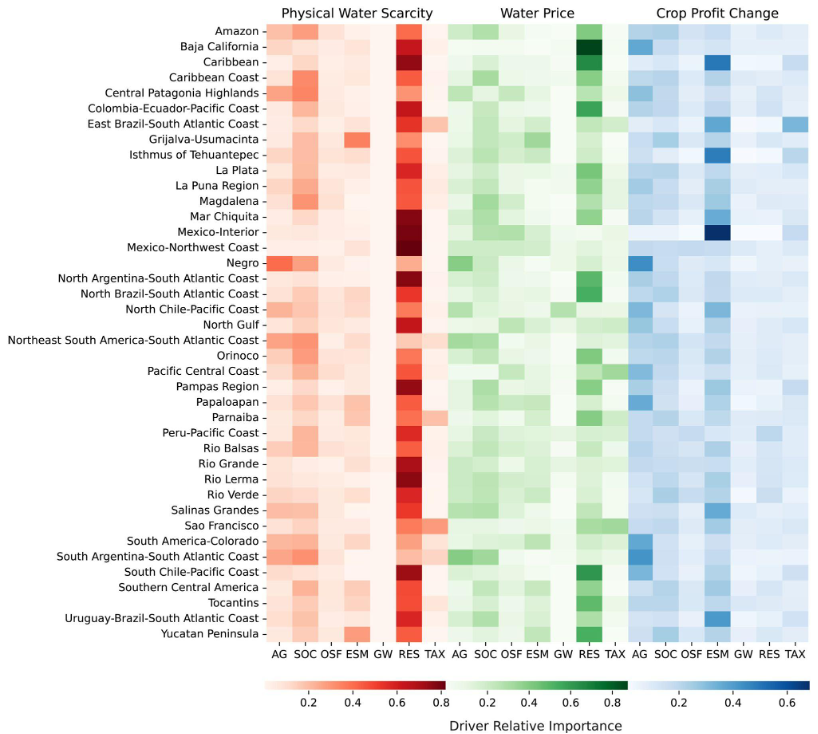
Fig. 4.1 Courtesty of Birnbaum et al. [4]: Heatmaps showing relative importance of parameters varied across scenarios for three water scarcity metrics for basins in Latin America and the Caribbean in 2100. The seven varied parameters are agriculture (AG), socioeconomics (SOC), other Shared Socioeconomic Pathway factors (OSF), earth system model (ESM), groundwater accessibility (GW), reservoir storage (RES), and carbon scenario background (labeled TAX here, but represents generic shadow price).#