GCAM v3.2 Documentation: The Energy System
Documentation for GCAM
The Global Change Analysis Model
View the Project on GitHub JGCRI/gcam-doc
The Energy System
<small>This page is valid for GCAM 3.1 r4503. Click here for info on how to view a previous version.</small>
In GCAM, the energy system represents processes of energy resource extraction, transformation, and delivery, ultimately producing services demanded by end users. Resources are classified as either depletable or renewable; in either case, the extraction costs of a given resource are generally assumed to increase as lower grade resources are employed, but are also subject to technological progress which can lower extraction costs for a given resource grade. Extraction costs can also rise with time as a consequence of incremental non-climate environmental requirements. In each time period, the market prices of all goods and services, including primary energy resources, land, agricultural goods and other products are determined within the general market system equilibrium.<br>
<br>Fossil fuel energy is produced from a graded, regionally disaggregated depletable resource base. Uranium is similarly assumed to be a depletable resource. Renewable energy forms are also disaggregated by region, and resource grade; however, by their nature the resource is not consumed by use. Primary energy forms can be transformed into six final energy products:<br>
- Refined liquid energy products<br>
- Processed gas products<br>
- Coal<br>
- Bioenergy solids<br>
- Electricity<br>
- Hydrogen
Energy transformation sectors convert resources initially into fuels consumed by other energy transformation sectors, and ultimately into goods and services consumed by end users. As with any sector in GCAM, different technologies may compete for market share; shares are allocated among competing technologies using a logit choice formulation. The cost of a technology in any period depends on two key exogenous input parameters—the non-energy cost and the efficiency of energy transformation—as well as the prices of the fuels it consumes. The non-energy cost represents all fixed and variable costs incurred over the lifetime of the equipment (except for fuel costs), expressed per unit of output. For example, a coal-fired electricity plant incurs a range of costs associated with construction (a capital cost) and annual operations and maintenance. The efficiency of a technology determines the amount of fuel required to produce each unit of output (e.g. the fuel efficiency of a vehicle i.e. passenger km per GJ, or the electricity to fuel ratio in a power plant). The prices of fuels are calculated endogenously in each time period based on supplies, demands, and resource depletion.<br>
Primary Energy Resources<br>
Primary energy forms include:<br>
- Oil
- Natural gas
- Coal
- Uranium
- Bioenergy
- Wind
- Solar
- Hydro
- Geothermal<br>
Production of oil, natural gas, coal, uranium, and bioenergy are assumed to be available to the global market. Coal, gas, and oil are produced from graded Resource Supply Curves. Bioenergy Production comes from purpose grown crops, crop residues, and municipal solid waste.<br>
Secondary Energy Carriers and Energy Conversion<br>
Refining<br>
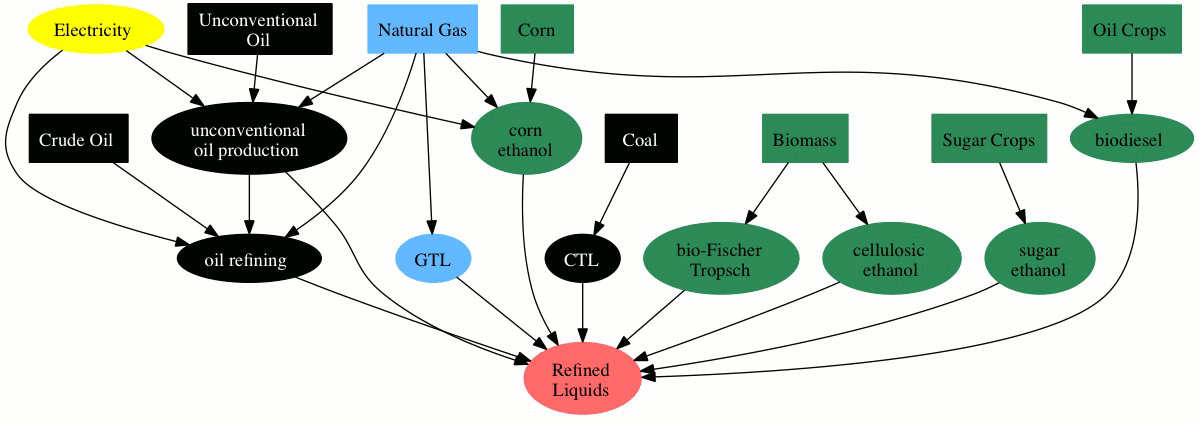
Liquid fuel refining in GCAM is represented in two different sectors, one of which produces fuels for the industrial sectors (most of which are used as feedstocks), and a second for the buildings and transportation sectors. Having two diferent sectors alows sector specific policies such as a biofuels standard that target only industry. Note that end use refineries have an additional cost adder to add a delivery charge. Refined liquid fuels for industry, buildings, or transportation can be produced from four different feedstocks: oil, coal, gas, and biomass.<br>
<br>These different technology options for refining are shown in Figure 1; the non-energy costs and input/output coefficients are shown in Table 1. A single oil refining technology, whose feedstock is some blend of crude or unconventional oils, has non-energy costs that are assumed to be the same as crude oil refining and additional energy costs are incurred upstream of the refinery for unconventional oil production (see below). Coal-to-liquids costs are informed by the Task Force on Strategic Unconventional Fuels (2007)<ref name=”StrategicUnconv07”>Shell - Shell International Ltd-Global Business Environment Unit. 2001. Energy Needs, Choices and Possibilities – Scenarios to 2050. London. Task Force on Strategic Unconventional Fuels (2007). America’s Strategic Unconventional Fuels. Volume III—Resource Technology Profiles.</ref>, and biomass liquids costs reflect DOE’s target in Aden et al. (2002)<ref name=”aden02”>Aden, A., M. Ruth, K. Ibsen, J. Jechura, K. Neeves, J. Sheehan, and B. Wallace (2002). Lignocellulosic Biomass to Ethanol Process Design and Economics Utilizing Co-Current Dilute Acid Prehydrolysis and Enzymatic Hydrolysis for Corn Stover. National Renewable Energy Laboratory, U.S. Department of Energy, Golden, CO. Technical Report NREL/TP-510-32438.</ref>. In summary, the energy requirements of crude oil refining are based on energy inputs and outputs for all petroleum refineries in the United States in 2005 (IEA 2007b)<ref name=”IEA07b”>IEA (2007b). Energy Balances of OECD Countries, 1960-2005. International Energy Agency, Paris, France.</ref>. Due to the large energy requirements for extracting and upgrading unconventional fuels, additional energy is required upstream of the refinery (note the electricity and gas inputs to the “unconventional oil production” sector in Figure 1 and Table 1). Unconventional oil is modeled as a blend of two technologies: Shell’s in situ shale oil extraction technology and Canada’s tar sands extraction technology. Shale oil extraction is assumed to require 275 kWh of electricity per barrel of synthetic crude (Bartis et al. 2005<ref name=”bartis05”>Bartis, J. T., T. LaTourrette, L. Dixon, D. J. Peteson, and G. Cecchine (2005). Oil Shale Development in the United States: Prospects and Policy Issues. RAND Corporation, Santa Monica, CA.</ref>, Dooley and Dahowski 2008<ref name=”dooley08”>Dooley, J.J., and R.T. Dahowski (2008). Large Scale U.S. Unconventional Fuels Production and the Role of Carbon Dioxide Capture and Storage Technologies in Reducing Their Greenhouse Gas Emissions. Presented at the 9th International Conference on Greenhouse Gas Control Technologies, November 2008, Washington, D.C.</ref>), and tar sands extraction and upgrading is assumed to require 700 cubic feet of natural gas per barrel of synthetic crude (Canada National Energy Board 2006)<ref name=”canadaNatEne06”>Canada National Energy Board (2006). Canada’s Oil Sands—Opportunities and Challenges to 2015: An Update. Canada National Energy Board, Calgary, Alberta. Accessed at http://www.neb.gc.ca/clf-nsi/rnrgynfmtn/nrgyrprt/lsnd/pprtntsndchllngs20152006/pprtntsndchllngs20152006-eng.pdf.</ref>. Since the GCAM supply curves implicitly include shale oil and tar sands/heavy oil as a single resource we model the cost of production based on a perecentage estimate of each region’s resource of each oil type as seen in Table 2.
<br>
Coal-to-liquids, gas-to-liquids and biomass liquids are modeled such that the refineries are optimized for production of fuels, not electricity. Therefore, although electricity is generated on-site from the input fuel, no excess electricity is sold back to the grid. The coal-to-liquids input/output coefficient is from Dooley and Dahowski (2008)<ref name=”dooley08”>Dooley, J.J., and R.T. Dahowski (2008). Large Scale U.S. Unconventional Fuels Production and the Role of Carbon Dioxide Capture and Storage Technologies in Reducing Their Greenhouse Gas Emissions. Presented at the 9th International Conference on Greenhouse Gas Control Technologies, November 2008, Washington, D.C.</ref>, and the gas-to-liquids input/output coefficient is based on Chevron’s proposed plant in Nigeria (Chevron Corporation 2008)<ref name=”chevron08”>Chevron (2008). Gas-to-Liquids. Chevron Corporation. Accessed at http://www.chevron.com/deliveringenergy/gastoliquids/.</ref>. Coal-to-liquids and biomass liquids are carbon-intensive, and the process produces several CO2 streams with different levels of capture costs. For this reason, two separate carbon capture and storage technology options are modeled for these plants.
<br>
The GCAM models two distinct liquid fuel technologies for conversion of cellulosic crop, ethanol and a Fischer-Tropsch process. In addition to cellulosic fermentation and the Fischer-Tropsch process, in GCAM 3.0 we have added conventional technologies linking food crops to the energy system, of particular importance for near term modeling of bioenergy production. The GCAM calibrates to existing, first-generation biofuels production, including corn ethanol and soybean biodiesel in the United States, as well as ethanol from sugarcane and sugar beets in Latin America and Western Europe, respectively. Inputs and costs to these first-generation technologies are summarized in Table 1, and compared to the advanced alternatives. Costs do not include feedstock cost, sources include (Perrin et al. 2009)<ref name=”perrin09”>Perrin, R. K., N. F. Fretes and J. P. Sesmero (2009). “Efficiency in Midwest US corn ethanol plants: A plant survey.” Energy Policy, Volume 37(4): 1309-1316,ISSN 0301-4215</ref> for corn ethanol, (Shapouri et al. 2006; Outlaw et al. 2007)<ref name=”shapouri06”>Shapouri, H., M. Salassi and J. Nelson (2006). “The Economic Feasibility of Ethanol Production From Sugar in the United States.” USDA</ref><ref name=”outlaw07”>Outlaw, J. L., L. A. Ribera, J. W. Richardson, J. da Silva, H. L. Bryant and S. L. Klose (2007). “Economics of Sugar-Based Ethanol Production and Related Policy Issues.” Journal of Agricultural and Applied Economics, Volume 39(02)</ref> for sugar ethanol, (Pimentel and Patzek 2005; van Kasteren and Nisworo 2007)<ref name=”pimentel05”>Pimentel, D. and T. W. Patzek (2005). “Ethanol Production Using Corn, Switchgrass, and Wood; Biodiesel Production Using Soybean and Sunflower.” Natural Resources Research, Volume 14(1): 65-76,ISSN 1520-7439, <DOI:10.1007/s11053-005-4679-8%3C/ref%3E%3Cref> name=”vanKasteren07”>van Kasteren, J. M. N. and A. P. Nisworo (2007). “A process model to estimate the cost of industrial scale biodiesel production from waste cooking oil by supercritical transesterification.” Resources, Conservation and Recycling, Volume 50(4): 442-458,ISSN 0921-3449</ref> for soybean, (Aden 2008)<ref name=”aden08”>Aden, A. (2008). “Biochemical Production of Ethanol from Corn Stover: 2007 State of Technology Model.”</ref> for cellulosic ethanol, and (van Vliet et al. 2009)<ref name=”vanvliet09”>van Vliet, O. P. R., A. P. C. Faaij and W. C. Turkenburg (2009). “Fischer-Tropsch diesel production in a well-to-wheel perspective: A carbon, energy flow and cost analysis.” Energy Conversion and Management, Volume 50(4): 855-876,ISSN 0196-8904</ref> for Fischer-Tropsch.
Figure 1: Technology options in liquid fuel refining.
 <br>
<br>
<br>
Table 1: Refining technology non-energy costs and input-output coefficients.
| Non-energy cost | Crude oil or<br>synthetic crude | Natural gas | Electricity | Coal | Dedicated Biomass | Crop Input | |
| $ / bbl | in / out | in / out | in / out | in / out | in / out | in (Kg) / out | |
| Unconventional oil production<br>Shale Oil | 0.160 | ||||||
| Unconventional oil production<br>Tar sands | 0.124 | ||||||
| Oil refining | 15.11 | 1.055 | 0.018 | 0.005 | |||
| Coal-to-liquids | 48.52 | 2.112 | |||||
| Gas-to-liquids | 32.35 | 1.654 | |||||
| Corn Ethanol | 43.11 | 0.320 | 0.030 | 112 | |||
| Sugar Ethanol | 51.60 | 582 | |||||
| Soybean biodiesel | 14.11 | 0.030 | 146 | ||||
| Biomass-FT | 49.92 | 1.960 | |||||
| Biomass-Cellulosic | 42.95 | 2.060 |
Table 2: Regional unconventional oil resource share.
| Region | Shale Oil | Tar sands/heavy oil |
| USA | 100% | 0% |
| Canada | 1% | 99% |
| Western Europe | 95% | 5% |
| Japan | 0% | 100% |
| Australia_NZ | 100% | 0% |
| Former Soviet Union | 84% | 16% |
| China | 33% | 67% |
| Middle East | 30% | 70% |
| Africa | 76% | 24% |
| Latin America | 14% | 86% |
| Southeast Asia | 50% | 50% |
| Eastern Europe | 100% | 0% |
| Korea | 0% | 100% |
| India | 0% | 100% |
Electricity<br>
Electricity in GCAM can be produced from nine fuel types, each of which may have multiple production technologies. Transmission and distribution costs and energy losses apply to all centrally-produced electric generation technologies (i.e. all but rooftop solar photovoltaic) as well as industrial combined heat and power. Electric generation technologies are broadly divided into two categories: existing capital and new installations. An exogenous retirement rate is assumed for existing capital, as this category actually represents many different vintages of power plants, some of which are presently near retirement.<br>
<br>It is assumed that the capital costs of this existing vintage are sunk, and therefore the non-energy costs do not figure into future operating decisions. Plants may be temporarily shut down if the input fuel costs exceed the average revenue from the electricity produced, but otherwise the production of electricity from the existing vintage is not subject to competition from new technologies. In the future, new installations are needed both to replace the retired stock and to meet growing demand for electricity. The market share for new installations to meet this demand is allocated among different technologies by a two-level nested logit choice mechanism, with technologies (e.g. IGCC, combustion turbine) competing within fuels (e.g. coal, nuclear, wind).<br>
<br>
More information on GCAM’s representation can be found at Electricity.
Hydrogen
Hydrogen is a component of present end-use fuel consumption. However, like renewable energy forms GCAM considers the potential for a greatly expanded and fully integrated energy system, including technologies for production, transmission and distribution, and consumption. The representation is designed to allow for a comprehensive examination of the interactions between hydrogen and other advanced technologies in the energy system. However, one limitation of the GCAM approach is that it does not address scale issues associated with a hydrogen infrastructure. A fixed transmission cost is assumed regardless of the scale of the hydrogen system. This is a simplification. The costs of transmission will depend heavily on scale, and discussions of large-scale hydrogen deployment often center on the issues associated with the creation of a large-scale transmission and distribution system.<br>
<br>Hydrogen supply is modeled in GCAM in similar fashion to electricity: hydrogen may be produced in central stations or in distributed “forecourts.” Central stations benefit from economies of scale, but incur transmission and distribution costs. There are more technology options for central station hydrogen production than for forecourt production. Although forecourt production can produce hydrogen only from natural gas or electricity, central stations can use natural gas, coal, or biomass, all with or without CCS, as well as direct conversion from nuclear, solar, and wind energy. In this application, wind and solar generation do not pay any intermittency-related costs. <br>
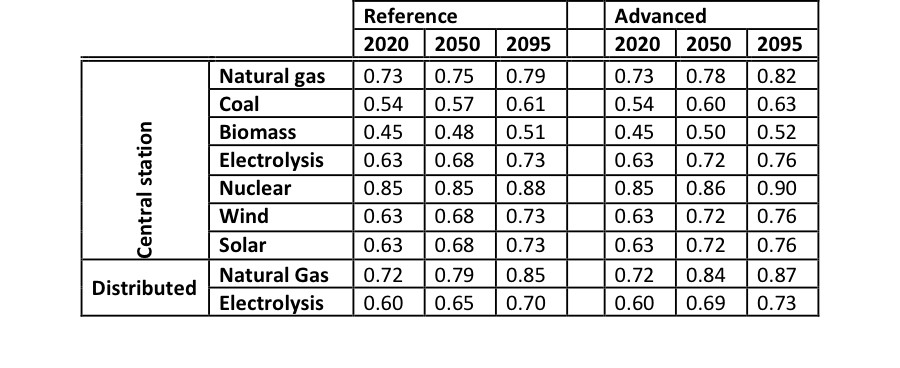
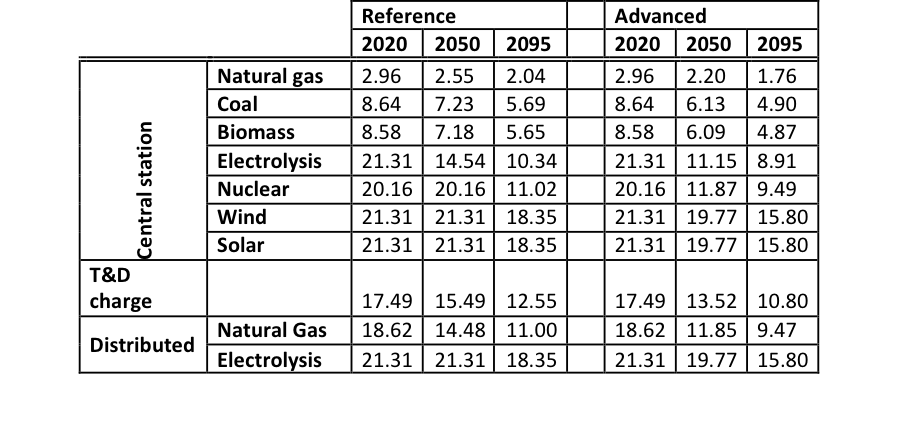
<br>Reference and advanced technology assumptions for hydrogen production are derived from the H2A production models (DOE 2008)<ref name=”defriesDOE08”>DeFries R, M Hansen, JRG Townshend, AC Janetos, and TR Loveland. 2000. A New Global 1km Data Set of Percent Tree Cover Derived from Remote Sensing. Global Change Biology 6:247-254. DOE (2008). DOE Hydrogen Program: H2A Analysis. U.S. Department of Energy, Hydrogen Program. Accessed at http://www.hydrogen.energy.gov/h2a_analysis.html.</ref>. Non-energy costs were calculated from these models by subtracting the feedstock fuel cost from the required break-even hydrogen price for each technology analyzed. Hydrogen production efficiencies by technology are shown in Table 2, and non-energy costs are shown in Table 3. Because the future role of hydrogen in the energy system is also highly dependent on the demand technologies, scenarios with advanced hydrogen supply technologies also have advanced fuel cell vehicles discussed in Transportation.
Table 2. Hydrogen production efficiencies by technology in reference and advanced scenarios.<br>
 <br>
<br>
Table 3. Hydrogen non-energy costs by technology in reference and advanced scenarios (2004$ / GJ).<br>
<br>
Gas Processing
Gas production in GCAM comes not only from natural gas but also coal and biomass gassification. Production from these sources are calibrated in the base years from the IEA Energy Balances<ref name=”IEA 2010”>IEA, 2010. Energy Balances of OECD Countries 1960-2008; Energy Balances of non-OECD Countries 1971-2008. International Energy Agency, Paris, France.</ref>. We assume no loss in processing of natural gas and a non-fuel cost of 0.59 $/GJ. Biomass gasification is assigned a 74% conversion efficiency,<ref name=”Berglund and Borjesson”>Berglund, M., Borjesson, P. Energy Analysis of Biogas Production. http://www.lth.se/fileadmin/energiportalen/Filer/Om_Energiportalen/Invigning/Posters/Energy_analysis_of_biogas_production_Maria_Berglund_P_l_B_rjesson.pdf%3C/ref%3E and coal gasification has a 75% efficiency.<ref name=”peabody2008”>St. Louis Business Journal, 2008. Peabody, ConocoPhillips choose site for Ky. plant. December 16, 2008. http://www.bizjournals.com/stlouis/stories/2008/12/15/daily25.html%3C/ref%3E Non-fuel costs of coal and biomass gasification are based on the capital and O&M costs of coal and biomass IGCC plants for electricity generation, with a deduction for the portions of these technologies that are specific to generatng electricity. Non-fuel costs of biomass gasification are 11.39 $/GJ and coal gasification are 8.83 $/GJ.
<br>
Gas pipeline energy use is also tracked; base year energy consumption for gas pipelines is from the IEA Energy Balances.<ref name=”IEA 2010”>IEA, 2010. Energy Balances of OECD Countries 1960-2008; Energy Balances of non-OECD Countries 1971-2008. International Energy Agency, Paris, France.</ref> The amounts of energy used in pipelines per the amount of total regional consumption of gas are held constant over time in all regions; these energy losses amount to between 1% and 15% of all gas consumption. An additional surcharge is given to delivered gas to end-use sectors of 3.70 $/GJ.
<br>
Carbon Dioxide Capture and Storage<br>
In scenarios in which carbon dioxide capture and storage (CCS) is allowed, CCS technologies are modeled in liquid fuel refining, electricity generation, hydrogen production, and cement production. In electric power plants, carbon capture is available only for the most advanced versions of the hydrocarbon-based generation technologies: natural gas combined cycle, and IGCC with coal, oil, and biomass. For hydrogen production, carbon capture is available as an option on central station production from coal, natural gas, and biomass. Typically these plants are allowed to compete starting in some future model period, usually 2020. In all of these cases, technologies with carbon capture compete directly with the equivalent technologies without carbon capture. For coal-to-liquids and biomass-to-liquids plants, two different CCS technologies are modeled, as there are two CO<sub>2</sub> streams from the production technology that have different capture costs. CCS Phase 1 captures only the high-pressure, relatively pure stream of CO<sub>2</sub> from the CTL conversion process itself. CCS Phase 2 captures this stream, as well as a dilute and lower-pressure stream from tail gas combustion that is more costly to capture (Dooley and Dahowski 2008)<ref name=”dooley08”>Dooley, J.J., and R.T. Dahowski (2008). Large Scale U.S. Unconventional Fuels Production and the Role of Carbon Dioxide Capture and Storage Technologies in Reducing Their Greenhouse Gas Emissions. Presented at the 9th International Conference on Greenhouse Gas Control Technologies, November 2008, Washington, D.C.</ref>.
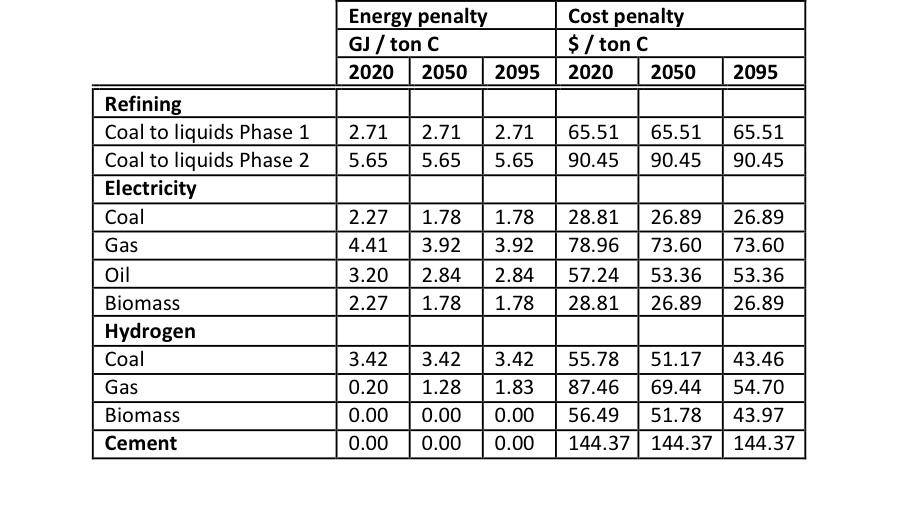
<br>CCS can dramatically reduce CO<sub>2</sub> emissions, but it incurs costs associated with capturing and storing carbon. The first portion of the CCS cost includes the capital and operating costs associated with capturing CO<sub>2</sub> and a consequent reduction in whole-system efficiency due to extra energy requirements for separating CO<sub>2</sub> from flue gases. The capture costs are represented in GCAM as a non-energy cost penalty and an efficiency penalty, the latter applied to the primary fuel consumed by the facility. These performance penalties are applied in proportion to the amount of CO<sub>2</sub> released by the underlying process that is captured and stored. Table 15 shows the capture energy requirements and non-energy costs used in the scenarios. These characteristics are assumed to be the same across all regions.<br>
<br>
The second portion of the CCS cost pertains to the transport and storage of CO<sub>2</sub>. As of GCAM 3.0 revision 4454, the GCAM incorporates regionally-specific supply curves for CO2 storage. These curves are based on updated values of Dooely et (2005)<ref>Dooley, J., Kim, S., Edmonds, J., Friedman, S., Wise, M., 2005a. A First Order Global Geologic CO2 Storage Potential Supply Curve and Its Application in a Global Integrated Assessment Model. Greenhouse Gas Control Technologies 1, 573-581.</ref>.
<br>
Table 4. Carbon capture costs, in terms of additional energy requirements, and additional costs, by technology. <br>
 <br>
<br>
Sources: Refining: Dooley and Dahowski (2008)<ref name=”dooley08”>Dooley, J.J., and R.T. Dahowski (2008). Large Scale U.S. Unconventional Fuels Production and the Role of Carbon Dioxide Capture and Storage Technologies in Reducing Their Greenhouse Gas Emissions. Presented at the 9th International Conference on Greenhouse Gas Control Technologies, November 2008, Washington, D.C.</ref>; Electricity: David and Herzog (2000)<ref name=”herzog00”>David J and H Herzog. 2000. The Cost of Carbon Capture. Presented at the Fifth International Conference on Greenhouse Gas Control Technologies, Cairns, Australia, August 13 - August 16.</ref>; Hydrogen: H2A model (DOE 2008)<ref name=”defriesDOE08”>DeFries R, M Hansen, JRG Townshend, AC Janetos, and TR Loveland. 2000. A New Global 1km Data Set of Percent Tree Cover Derived from Remote Sensing. Global Change Biology 6:247-254. DOE (2008). DOE Hydrogen Program: H2A Analysis. U.S. Department of Energy, Hydrogen Program. Accessed at http://www.hydrogen.energy.gov/h2a_analysis.html.</ref>; Cement: Mahasenan et al. (2005)<ref name=”mahasenan05”>Mahasenan, N., R.T. Dahowski, and C.L. Davidson (2005). The Role of Carbon Dioxide Capture and Storage in Reducing Emissions from Cement Plants in North America. In Greenhouse Gas Control Technologies, Volume I, eds. E.S. Rubin, D.W. Keith, and C.F. Gilbor, Elsevier Science.</ref>.
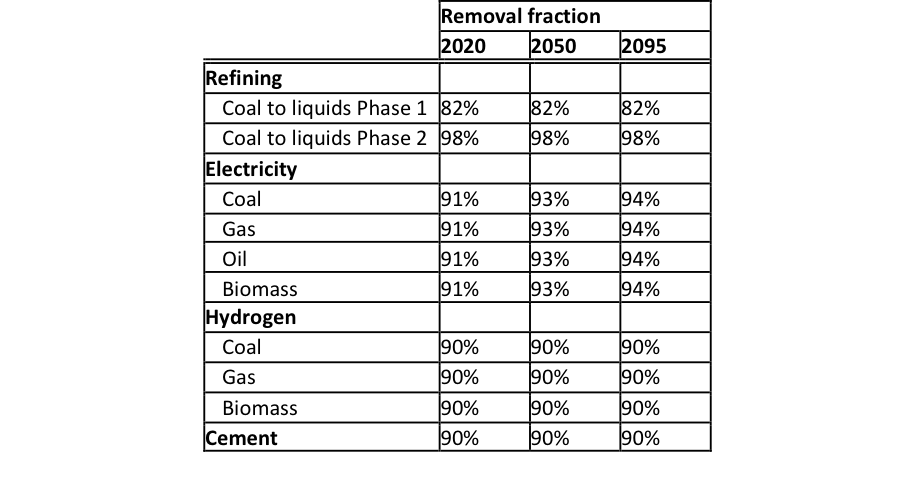
<br>The third portion of the costs of technologies with CCS is associated with the CO<sub>2</sub> that is vented to the atmosphere, either because it is uneconomic or technically infeasible to capture. Even CCS-equipped facilities do emit some CO<sub>2</sub>, and these emissions are priced in the same way as any other carbon emissions in the energy system. The capture rates for CCS technologies are shown in Table 5 for all CCS technologies in the model.<br>
<br>
Table 5. Carbon capture rates, by technology. The remaining CO<sub>2</sub> is vented to the atmosphere, and is subject to any applicable carbon prices. <br>
CO<sub>2</sub> storage can also be treated as a finite geographically distributed resource in GCAM as described in Edmonds, et al. (2007)<ref name=”edmonds07”>Edmonds, J., J. Dooley, S. Kim, S. Friedman, and M. Wise. 2007. “Technology in an Integrated Assessment Model: The Potential Regional Deployment of Carbon Capture and Storage in the Context of Global CO2 Stabilization,” Human-Induced Climate Change: An Interdisciplinary Perspective, (eds. Michael Schlesinger, Francisco C. de la Chesnaye, Haroon Kheshgi, Charles D. Kolstad, John Reilly, Joel B. Smith and Tom Wilson), Cambridge University Press. pp.181-197.</ref>. In this mode GCAM distinguishes five candidate geologic storage reservoirs types:<br>
- On-shore deep saline formations<br>
- Off-shore deep saline formations<br>
- Depleted oil fields<br>
- Depleted gas fields<br>
- Unminable coal deposits<br>
<br>
Each GCAM region is assigned an estimated maximum potential capacity (MPC) for each of the five classes of geologic CO2 reservoirs listed above. The table below shows effective CO2 Storage by region. These are the values used in this implementation. The actual construction of supply curves based on these aggregate values is described in the “Approach” section. A blank signifies that there is no literature that speaks to the capacity for that class of reservoir in that region. A zero means someone looked at it and there is no resource or it is a small fraction of 1GtCO2. As far as modeling in the GCAM, both are considered a “0”. The CCS supply curves use regional storage supply curves based on an updated version of Dooley et al (2005)<ref>Dooley, J.J., Kim, S.H., Edmonds, J., Friedman, S.J., Wise, M., 2005b. A First Order Global Geologic CO2 Storage Potential Supply Curve and Its Application in a Global Integrated Assessment Model. Greenhouse Gas Control Technologies 1, 573-581.</ref>. This resource is split into 4 distinct grades; the lowest cost grade costs $0.036/tCO2 (in $2005) and encompasses 0.5% of the resource in each region. The cost goes up from here, with the bulk of the land based storage resource being available at costs under $10/tCO2 (Dahowski et al., 2011)<ref>Dahowski, R.T., Davidson, C.L., Dooley, J.J., 2011. Comparing large scale CCS deployment potential in the USA and China: A detailed analysis based on country-specific CO2 transport &amp; storage cost curves. Energy Procedia 4, 2732-2739.</ref>. Maximum potential reservoir capacity estimates used in GCAM are given in Table 6.
<br>
The regional land-based storage is not traded, but there is a higher cost offshore geologic storage that any region can use. To be conservative, this is $96/tCO2, a cost several times the $32/tCO2 estimate in Decarre et al (2010)<ref>Decarre, S., Berthiaud, J., Butin, N., Guillaume-Combecave, J.-L., 2010. CO2 maritime transportation. International Journal of Greenhouse Gas Control 4, 857-864.</ref>. This offshore resource is not characterized in detail and instead is assumed to be vast to the point where cost is likely to be more limiting than the available resource.
<br>
Table 6. First-order Estimates of Geologic CO2 Storage Potential, all Resource Grades, by Region (GT CO2)
| <br> | Coal Basins | Depleted Oil Plays | Gas Basins | Deep Saline Formation On-shore | Deep Saline Formation Off-shore | Total |
| USA | 59 | 107 | 1161 | 491 | 1819 | |
| Canada | 1 | 14 | 38 | 53 | ||
| Western Europe | 0 | 22 | 36 | 43 | 101 | |
| Japan | 3 | 41 | 66 | 110 | ||
| Australia | 12 | 265 | 152 | 429 | ||
| Former Soviet Union | 16 | 256 | 272 | |||
| China | 9 | 4 | 4 | 1716 | 584 | 2316 |
| Middle East | 53 | 169 | 222 | |||
| Africa | 3 | 9 | 78 | 90 | ||
| Latin America | 7.575 | 45 | 1562 | 1614 | ||
| Southeast Asia | 3.75 | 33 | 37 | |||
| Eastern Europe | 1 | 2 | 13 | 15 | ||
| Korea | ||||||
| India | 0 | 1 | 14 | 43 | 41 | 100 |
| Total Global Capacity | 70 | 247 | 530 | 4,952 | 1,379 | 7,178 |
<br>
GCAM now also has a Low and High CCS storage scenario included, in addition to the reference scenario detailed above. We model the low scenario as one that does not have any offshore storage, and reduces the total resource substantially. The only CO2 storage resource assumed available in the low case is the cheapest grade and ½ of the grade the next level up. This represents about 5% of the available resource in the reference case. The high scenario lowers the costs by 20%, and has larger regional markets for land based CO2 storage.
End-Use Sectors<br>
End-use consumers determine the total amount of energy that is consumed along with the mix of secondary fuels that supply this energy. In GCAM, there are three end-use sectors in each of the model’s fourteen regions: Buildings, Industry, and Transportation. All end-use sectors are represented in detail in the U.S., as discussed below. In all other regions, detailed, service-based representations are used for the transportation sector and for the cement industry; all remaining industries and the buildings sector are represented in aggregate form. The detailed U.S. sectors were used as the basis for determination of key model parameters in the non-U.S. aggregate sectors. The detailed U.S. end use representations are discussed below.
<br>It is important to distinguish between the two factors that drive the demand for energy: the demand for energy services and the technologies that consume fuels to provide these services. Examples of service demands include the demand for vehicle miles, the demand for process heat in industry, and the demands for space heating and cooling for residential buildings. In GCAM, the aggregate sectors determine the total quantity of aggregate service consumed according to a sector-based demand function, which grows in response to economic and population growth and responds to changes in the prices by which these services are delivered.
<br>Historically, per capita demand for energy has not grown at the rate of per capita gross domestic product (GDP) growth. One reason is that the demands for underlying services do not necessarily grow at the rate of GDP growth. For example, the per-capita demand for building floor space tends to grow more slowly than per-capita GDP. Similarly, as economies develop, they may move more toward service-oriented industries and away from heavy industry. For these reasons, the demands for services do not all grow at the rate of economic growth in the scenarios.
<br>The second factor driving end-use energy demand and leading to a divergence between GDP growth and energy demand growth is improvement in the technologies that provide end-use services. More efficient vehicles, industrial processes, and space heating and cooling equipment, for example, can all lower the energy required to supply their respective services. In GCAM, the efficiencies of the generic end use technologies change over time to capture this technological advance.
<br>The aggregate approach to energy demands in GCAM has the valuable characteristic that it separates the effects of service demand growth and future technological improvement. However, the weakness of the aggregate approach is that the services being provided by these aggregate end-use sectors are not explicitly defined. This makes it difficult to model qualitative changes in service that may have a large influence on technology choice and future energy demand by end-use sectors. For example, higher incomes may increase demand for home appliances and electronics moreso than heating or water heating services, which will tend to increase the share of electricity in buildings sector final energy demands.
<br>As well, end-use technologies consist of many different types of equipment used in a very wide variety of applications, and the interactions between different technologies may be important. In the buildings sector, for example, improvements in building shell thermal characteristics can reduce demands for space heating. In the industrial sector, the energy requirements for production of goods might be reduced by a number of improvements, such as (a) more efficient boilers, (b) deployment of less heat-intensive production technologies, (c) increased use of recycled materials as feedstocks, or (d) use of combined heat and power (cogeneration) systems.
<br>In an effort to represent these kinds of interactions, and to quantitatively assess their implications for the energy system as a whole, this analysis uses detailed buildings and industry representations that have been developed for the U.S. region only. Actual services are explicit where possible; for instance, buildings sector service is represented in terms of residential and commercial floorspace. For non-U.S. regions, aggregate end-use sectors are still used, but with technology improvement rates and service demand elasticities based on analysis of the detailed U.S. model. This approach has allowed for detailed examination of end use in the U.S. and consistent representations internationally.<br><br><br>
References
<references /><br>
A complete set of references is available at References.
<br> <br>