GCAM v3.2 Documentation: Electricity
Documentation for GCAM
The Global Change Analysis Model
View the Project on GitHub JGCRI/gcam-doc
Electricity
<span class=”Apple-style-span” style=”font-size: 11px; “>This page is valid for GCAM 3.0 r3371. Click here for info on how to view a previous version.</span>
<span class=”Apple-style-span” style=”font-size: 11px; “>GCAM Revision History</span>Electricity generation in the GCAM is represented at a relatively aggregate level, as historically development has focused on introducing new electricity generation technologies or improving the representation of existing technologies within the model. Accordingly, the electricity market in each model region is constructed as a single annual market for an average-priced electricity. In the US, additional detail has been added that splits the load curve among four generation segments: baseload, intermediate, peak, and subpeak<ref>Luckow P, MA Wise, and JJ Dooley. 2011. Deployment of CCS Technologies across the Load Curve for a Competitive fckLRElectricity Market as a Function of CO2 Emissions Permit Prices. In 10th International Conference on Greenhouse Gas fckLRControl Technologies, September 19-23, 2010, Amsterdam, The Netherlands. Energy Procedia, vol. 4, ed. J Gale, C fckLRHendriks, W Turkenberg, pp. 5762-5769. Elsevier, London, United Kingdom. <doi:10.1016/j.egypro.2011.02.572%3C/ref%3E>. Electricity pricing is based on the average total cost of new generation in each of these segments.
The technology characteristics detailed here apply to both the detailed US electricity market as well as the aggregrate electricity markets in other regions.
Fossil and Biomass Electricity<br>
Hydrocarbon-fueled power plants currently supply about two thirds of the world’s electricity. The fuel efficiency of the existing stock varies considerably; average efficiencies for existing fossil and biomass power plants are shown by GCAM region in Table 1. The absolute lifetime of coal and biomass power plants is assumed to be 75 years, while for gas and oil plants it is 60 years. An s-curve retirement function is used to retire some fraction of the existing plants each year; this is characterized such that 50% of plants are retired after 45 years. New builds are assumed to continue operating throughout their lifetime, specified as 60 years for coal and biomass and 45 years for gas and oil.<br>
| Coal | Natural Gas | Oil | Biomass | |
| Africa | 0.37 | 0.37 | 0.30 | 0.10 |
| Australia and New Zealand | 0.35 | 0.35 | 0.29 | 0.17 |
| Canada | 0.39 | 0.39 | 0.40 | 0.37 |
| China | 0.32 | 0.38 | 0.33 | 0.25 |
| Eastern Europe | 0.32 | 0.30 | 0.30 | 0.28 |
| Former Soviet Union | 0.25 | 0.27 | 0.28 | 0.13 |
| India | 0.27 | 0.42 | 0.33 | 0.15 |
| Japan | 0.42 | 0.45 | 0.48 | 0.45 |
| Korea | 0.39 | 0.49 | 0.48 | 0.16 |
| Latin America | 0.35 | 0.40 | 0.35 | 0.30 |
| Middle East | 0.40 | 0.30 | 0.35 | n/a |
| Southeast Asia | 0.33 | 0.42 | 0.40 | 0.28 |
| U.S. | 0.37 | 0.44 | 0.36 | 0.28 |
| Western Europe | 0.38 | 0.48 | 0.37 | 0.28 |
Table 1: Efficiencies of existing stock of fossil and biomass electric power plants by GCAM region<br>
In the future, all regions of the world are assumed to have access to the same generation technologies, and at the same non-energy costs. Cost assumptions and efficiencies of these technologies are based on the 2008 Annual Energy Outlook (EIA 2008) and are shown in Table 2. For each fuel, three technologies are available: a conventional technology similar to today’s technology, an advanced technology, and an advanced technology with carbon capture and storage.<br>
| 2020 | 2050 | 2095 | |
| Non-energy cost | Efficiency | Non-energy cost | |
| cents/kWh | output/input | cents/kWh | |
| Pulverized coal | 3.93 | 0.39 | 3.49 |
| Coal (IGCC) | 4.42 | 0.43 | 3.42 |
| Gas Turbine (peak) | 9.83 | 0.38 | 8.72 |
| Gas (CC) | 1.82 | 0.55 | 1.41 |
| Oil Turbine (peak) | 9.83 | 0.38 | 8.72 |
| Oil (IGCC) | 3.98 | 0.43 | 3.08 |
| Biomass | 4.74 | 0.38 | 4.2 |
| Biomass (IGCC) | 5.37 | 0.42 | 4.16 |
Table 2: Costs and efficiencies of new fossil fuel and biomass power plants in GCAM<br>
Nuclear<br>
Three groups of nuclear power technologies can be modeled: currently operational conventional light-water reactors (LWR); next generation advanced thermal neutron spectrum reactors; and future, fast neutron spectrum reactors (FR), including conceptual breeder and burner reactors. These reactors are referred to as Gen II, Gen III and Gen IV reactors, respectively. The Gen III reactor category includes evolutionary advanced light-water reactors and other advanced reactor designs with improved economics and safety features referred to as Gen III +. The principal characteristics of all Gen III reactors are lower and more competitive capital costs and improved operating and safety features than conventional Gen II reactors. Few Gen III reactors are currently deployed but have great potential for near-term deployment, and future Gen III reactors may have the potential for fuel recycling. Gen IV reactors’ principal objective is to close the nuclear fuel cycle and eliminate the concern for natural fissile uranium limitations while minimizing the amount of waste generated. Gen IV reactors are likely to convert or breed nuclear fuels, and have the ability to consume all actinides (tracked as part of the nuclear waste stream in GCAM) for the reduction of nuclear waste. Gen III+ and Gen IV technologies may have other potential benefits such as the ability to produce hydrogen gas.<br>
<br>GCAM has been used to explore the implications of finite and limited capacities for waste disposal on global use of nuclear energy. GCAM treats nuclear waste disposal explicitly as a finite, depletable resource. Scarcity rent for nuclear waste disposal is included in the economic cost of nuclear plants and affects the investment in new nuclear power. Scarcity rent and repository capacity does not affect the deployment of nuclear power until the available repository capacity is nearly exhausted, however.<br>
<br>Current regional policies for the management of high-level nuclear waste vary. The United States has pursued a once-through strategy where spent nuclear fuel is to be directly disposed of in a geologic repository at Yucca Mountain in Nevada. A fixed fee of 1 mill/kWhr (0.1 cent/kWhr) is charged to nuclear electricity generated for the development and eventual disposal of spent fuel in Yucca Mountain. We apply a fixed cost for waste disposal based on the US disposal fee and utilize a range of assumptions for the potential availability of repository capacity.<br>
<br>Since the potential global capacities for permanent nuclear waste disposal are uncertain, GCAM can be used to investigate a range of limits on waste disposal capacities, as well as an unconstrained disposal scenario.<br>
<br>Regional storage availability is highly varied. The US disposal facility at Yucca Mountain has a legislative disposal capacity of 70,000 metric tons of spent fuel. However, the physical limit of Yucca Mountain for waste disposal could be significantly higher than the legislated limit. According to a report by the US Electric Power Research Institute (EPRI) the physical capacity of Yucca Mountain is estimated to be a factor of four to nine times greater than the legislated capacity. <br>
<br>Waste disposal can be modeled as a permanent or retrievable repository or part of a larger central repository. We do not distinguish between forms in this analysis, but GCAM requires that there is a place for waste disposal. To the extent that that disposal is limited, there are implications for the role of nuclear energy technology in the global energy system.<br>
<br>GCAM frequently runs three scenarios for nuclear power. In the first, the nuclear power sector is not allowed to expand beyond present-day deployment. Reactors are replaced or upgraded as needed to maintain this level of electrical output, but nuclear power never competes economically in markets for electricity generation. In any scenarios allowing nuclear expansion (i.e. scenarios with reference or advanced nuclear technology assumptions), it is implicitly assumed that issues of safety and waste disposal are adequately addressed, and improved to the point where social acceptability does not constrain large-scale expansion of nuclear power. These improvements allow nuclear power to compete economically with all other electric generation technologies. The advanced technology scenarios are distinguished from the reference in having accelerated cost decreases in the future; reference and advanced scenario non-energy costs are shown in Table 3.<br>
| align=”center” style=”background-image: initial; background-attachment: initial; background-origin: initial; background-clip: initial; background-color: rgb(240, 240, 240); background-position: initial initial; background-repeat: initial initial;” | colspan=”3” align=”center” style=”background-image: initial; background-attachment: initial; background-origin: initial; background-clip: initial; background-color: rgb(240, 240, 240); background-position: initial initial; background-repeat: initial initial;” | Reference | align=”center” style=”background-image: initial; background-attachment: initial; background-origin: initial; background-clip: initial; background-color: rgb(240, 240, 240); background-position: initial initial; background-repeat: initial initial;” | colspan=”3” align=”center” style=”background-image: initial; background-attachment: initial; background-origin: initial; background-clip: initial; background-color: rgb(240, 240, 240); background-position: initial initial; background-repeat: initial initial;” | Advanced | ||
| 2020 | 2050 | 2095 | |||||
| Gen III | 5.09 | 4.93 | 4.72 |
Table 3: Nuclear power plant non-energy costs (2004 cents / kWh) in the reference and advanced technology scenarios<br>
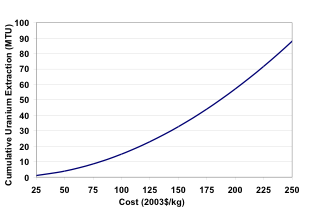
Assumptions on the availability of natural uranium vary widely. In the GCAM reference scenario, we use a supply curve for natural uranium based on a generalized simple crustal model of the relationship between uranium abundance and concentration fitted to the resource estimates and costs from the IAEA Redbook. This uranium supply curve, displayed in Figure 1, provides the global availability of uranium in million metric tons (MTU) as a function of price ($/kgU). We refer to this supply curve as the PPM-Cost Model (PPM). The availability of uranium at a given price from the PPM supply curve falls within the range of estimates derived by the Gen IV Fuel Cycle Crosscut Group (FCCG) and Deffeyes and MacGregor. It is worth noting that the natural uranium supply curve is assumed to be continuous and that significant amounts of natural uranium are available beyond those estimates in the Redbook data in lesser concentrations but at higher costs. Any estimates of the future cost of undiscovered mineral resources, whether conventional or not, are speculative and the judicious selection of a particular model depends on how it will be used. Estimates of cost and of the practicality of recovery vary widely, however. In our study, we assume that uranium resources are available if prices rise sufficiently high.

Figure 1: Uranium Supply Curve<br><br>
Hydroelectricity<br>
Hydroelectric power currently accounts for about 16 percent of the global electricity supply, and is an important component of the generation mix in many regions. The deployment of hydroelectric power is influenced strongly by political and social influences, which often play a more important role than economic considerations. For this reason, future generation from hydroelectric power is set exogenously for each region through 2095 in GCAM. Near-term deployment is based on inventories of present dam construction, and in the long term, relative growth rates in each region are based on the economically feasible potential in IHA (2000). Table 4 shows future hydroelectric output by GCAM region.<br>
| <br> | 2005 | 2020 | 2050 | 2095 |
| Africa | 0.33 | 0.33 | 0.98 | 1.96 |
| Australia and New Zealand | 0.14 | 0.14 | 0.18 | 0.25 |
| Canada | 1.31 | 1.39 | 1.55 | 1.79 |
| China | 1.55 | 2.66 | 3.29 | 4.23 |
| Eastern Europe | 0.25 | 0.25 | 0.33 | 0.46 |
| Former Soviet Union | 0.88 | 0.97 | 1.35 | 1.92 |
| India | 0.36 | 0.40 | 0.78 | 1.35 |
| Japan | 0.28 | 0.28 | 0.30 | 0.33 |
| Korea | 0.01 | 0.01 | 0.03 | 0.06 |
| Latin America | 2.33 | 2.61 | 3.38 | 4.52 |
| Middle East | 0.08 | 0.08 | 0.27 | 0.55 |
| Southeast Asia | 0.31 | 0.31 | 0.59 | 1.02 |
| U.S. | 0.98 | 0.98 | 1.01 | 1.05 |
| Western Europe | 1.71 | 1.71 | 1.80 | 1.93 |
Table 4: Assumed hydroelectricity generation (EJ/yr) by GCAM region
Solar and Wind<br>
Solar and wind power are abundant natural resources that can be used to produce electricity. Although solar and wind deployment worldwide is small at present (less than one percent of global electricity supply), the potential for future growth may be enormous. Integrated assessment models have historically struggled to accurately model the competition of solar and wind power within the electricity system due to their inherent availability and variability limitations.<br>
<br>In GCAM, the technologies of solar and wind power are assigned three different costs: an exogenous non-energy cost, similar to other electric technologies; endogenous ancillary costs, associated with resource intermittency; and resource costs, input as exogenous resource supply curves, representative of costs that are expected to increase with deployment as least-cost sites are used first. Non-energy costs are calculated from assumptions of capital costs, O&M costs, and capacity factors (see Table 5 and Table 6). The rooftop photovoltaic (PV) technology does not incur the transmission and distribution costs and energy losses that apply to all other electric generation technologies. As shown in Table 5, costs of all solar and wind technologies are assumed to decrease in the reference technology scenarios, and even further in the advanced technology scenarios. Solar costs vary by region, representative of different levels of average insolation in all regions. These estimates, developed from a GIS-based analysis, are shown in Table 6.<br>
<br>
| align=”center” style=”background-image: initial; background-attachment: initial; background-origin: initial; background-clip: initial; background-color: rgb(240, 240, 240); background-position: initial initial; background-repeat: initial initial;” | align=”center” style=”background-image: initial; background-attachment: initial; background-origin: initial; background-clip: initial; background-color: rgb(240, 240, 240); background-position: initial initial; background-repeat: initial initial;” | align=”center” style=”background-image: initial; background-attachment: initial; background-origin: initial; background-clip: initial; background-color: rgb(240, 240, 240); background-position: initial initial; background-repeat: initial initial;” | colspan=”3” align=”center” style=”background-image: initial; background-attachment: initial; background-origin: initial; background-clip: initial; background-color: rgb(240, 240, 240);” | Reference | align=”center” style=”background-image: initial; background-attachment: initial; background-origin: initial; background-clip: initial; background-color: rgb(240, 240, 240);” | colspan=”3” align=”center” style=”background-image: initial; background-attachment: initial; background-origin: initial; background-clip: initial; background-color: rgb(240, 240, 240);” | Advanced | ||||
| 2005 | 2020 | 2050 | 2095 | ||||||||
| Central PV | |||||||||||
| Capital cost* | $/kW | 6500 | 4278 | 2333 | 1662 | ||||||
| O&M cost | $/kW-yr | 25 | 25 | 18 | 15 | ||||||
| DC-AC conversion factor | % | 77% | 80% | 87% | 97% | ||||||
| CSP | |||||||||||
| Capital cost | $/kW | 3004 | 2786 | 2397 | 1913 | ||||||
| O&M cost | $/kW-yr | 47 | 43 | 37 | 30 | ||||||
| CSP with storage | |||||||||||
| Capital cost | $/kW | 6008 | 5573 | 4795 | 3827 | ||||||
| O&M cost | $/kW-yr | 47 | 43 | 37 | 30 | ||||||
| Wind | |||||||||||
| Capital cost | $/kW | 1167 | 1124 | 1043 | 932 | ||||||
| O&M cost | $/kW-yr | 36 | 30 | 28 | 26 | ||||||
| Storage cost adder | $/kW | 658 | 566 | 469 | 419 |
* PV capital cost is reported per peak DC power rating.
Table 5: Solar and wind technology cost assumptions for reference and advanced scenarios
| Central PV | Rooftop PV | CSP | |
| w/storage | |||
| Africa | 20.3 | 25.3 | 30.9 |
| Australia and New Zealand | 23.4 | 29.1 | 35.6 |
| Canada | 33.5 | 41.7 | 51.0 |
| China | 27.6 | 34.4 | 42.0 |
| Eastern Europe | 33.6 | 41.9 | 51.2 |
| Former Soviet Union | 34.0 | 42.3 | 51.7 |
| India | 22.6 | 28.2 | 34.4 |
| Japan | 29.3 | 36.4 | 44.5 |
| Korea | 27.3 | 34.0 | 41.6 |
| Latin America | 22.3 | 27.8 | 33.9 |
| Middle East | 20.5 | 25.5 | 31.2 |
| Southeast Asia | 22.3 | 27.8 | 34.0 |
| U.S. | 27.2 | 33.9 | 41.4 |
| Western Europe | 32.6 | 40.6 | 49.6 |
Table 6: Levelized non-energy costs of solar technologies in all GCAM regions in 2020, reference scenario (cents / kWh).
The intermittency-related costs owing to large-scale solar and wind expansion are not currently well understood, but do pose a potentially important limitation on renewable energy deployment. In GCAM, there are two technological options for maintaining grid reliability. The first option is for the renewable technologies to pay for the purchase and operation of backup gas turbines, representative of the lowest capital cost option for capacity that would be dispatched infrequently. This cost consists of the capital cost of a required amount of capacity, plus any variable O&M costs and fuel costs associated with its operation. A capacity factor of 5 percent is assumed for the backup turbines, as these would only need to be operated infrequently.<br>
<br>
The amount of backup capacity required differs somewhat between wind and solar technologies. For solar, backup capacity is determined by the share of solar capacity relative to the total amount of capacity in the electric sector. At low levels of deployment, very little backup capacity is required, but as deployment increases, the backup requirement increases as a logistic function until at 20 percent of the grid capacity, each additional unit of solar capacity requires one unit of gas combustion turbine capacity. Note that this is not a capacity limit to solar deployment; solar power may still expand above this ratio by paying for the required backup.<br>
<br>For wind power, the ancillary capacity requirements are calculated as a function of the variability of the wind resource and the size of the wind generation relative to the size of the electricity sector, assuming that wind variance and normal load variance are uncorrelated. This formulation is derived from the formulation for reserve margin used in the NREL WINDS model (NREL 2006).<br>
<br>As a second option for maintaining grid reliability, for each central station solar or wind electric technology, there is a corresponding, more capital-intensive technology option with integrated energy storage. This generic storage technology could represent a facility with molten salt, batteries, or pumped hydroelectricity; the important feature is that the coupled system is capable of providing power at relatively constant dispatch, and thus functions as a baseload technology on the grid. There is some energy lost in the extra conversions, but no secondary fuel (e.g. gas) is required for operation.<br>
<br>The third and final component of the cost of renewable technologies is resource costs, calculated from exogenous supply curves. These are used for technologies with marginal costs that are assumed to increase with deployment, such as long-distance transmission line costs that would be required to produce power from remote wind resources. Only wind and rooftop PV are assigned resource supply curves; central station solar technologies are assumed to have constant marginal costs regardless of deployment levels.<br><br> 
 <br>
<br>
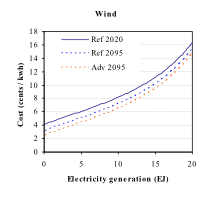
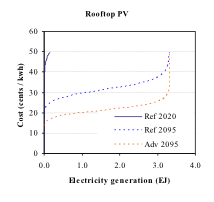
Figure 2. Wind and rooftop solar costs with reference and advanced technology assumptions. These supply curves include technology and resource costs, but exclude any ancillary costs.<br>
For wind power, the supply curve for the U.S. region is based on NREL (2008), and is shown in Figure 2. The supply curve shown also includes technology non-energy costs, but not ancillary costs. The same supply curve is assumed for non-U.S. regions, but with maximum resource amounts scaled to estimates from GIS-based analysis, also informed by IEAGHG (2000). Assumed maximum resources for all GCAM regions are shown in Table 7. The supply curve for rooftop PV in the U.S. is from NREL (P. Denholm and R. Margolis, pers. comm.), and is also shown in Figure 3. The assumed limit in non-U.S. regions, shown in Table 7, is based on a GIS analysis of solar irradiance by region.
| Geothermal | |||
| Rooftop PV | Wind | Hydrothermal | |
| Africa | 9.1 | 135.6 | 0.4 |
| Australia and New Zealand | 0.4 | 12.7 | 0.2 |
| Canada | 0.4 | 17 | 0 |
| China | 16.1 | 36.3 | 0.1 |
| Eastern Europe | 1.6 | 3.1 | 0.1 |
| Former Soviet Union | 2.9 | 135.1 | 0.3 |
| India | 10.5 | 1.1 | 0.1 |
| Japan | 1.1 | 1 | 0.1 |
| Korea | 0.6 | 0.6 | 0 |
| Latin America | 5.9 | 53.3 | 1 |
| Middle East | 1.9 | 46 | 0.1 |
| Southeast Asia | 8 | 8.4 | 0.6 |
| U.S.A | 4.7 | 29.2 | 0.8 |
| Western Europe | 5.3 | 6.6 | 0.4 |
Table 7: Maximum annual electricity production by renewable resource technology and GCAM region (EJ / yr). No resource limits are applied to central station solar technologies.
<div><br></div>
Geothermal<br>
Like solar and wind, geothermal energy currently accounts for less than one percent of global electricity generation, but the potential resource may be large. For instance, a recent study assessed the feasibility of using enhanced geothermal systems (EGS) to install 100 GW (3 EJ baseload) of geothermal capacity in the U.S. alone (MIT 2006). Due to the high R&D costs that would be necessary to bring EGS to commercial deployment, however, this technology is only allowed to compete economically in advanced technology scenarios. The reference scenarios are constrained to conventional (hydrothermal) geothermal technology, which has a much smaller resource base.<br>
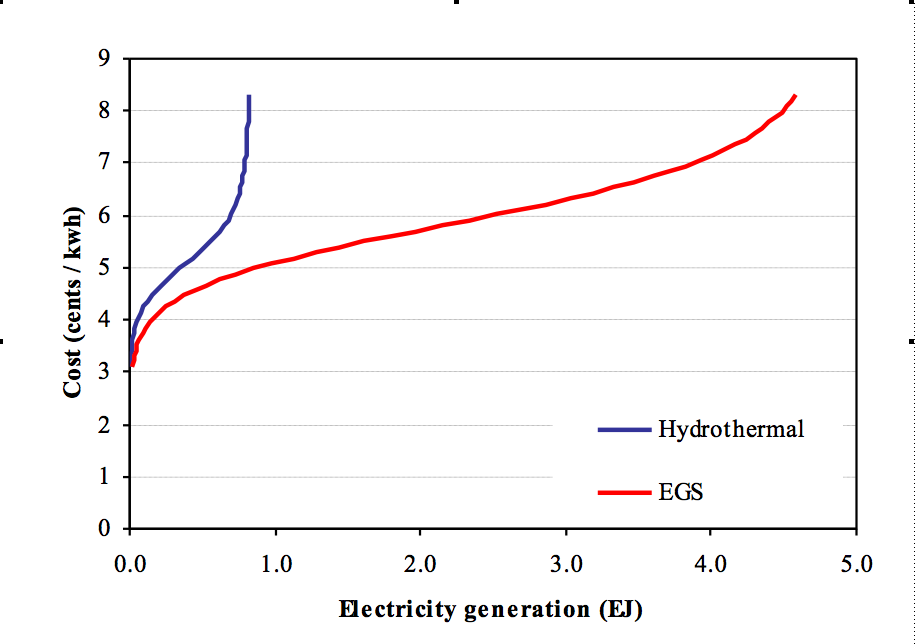
<br>Geothermal costs in GCAM are input as exogenous supply curves. Supply curves assumed for hydrothermal and EGS resources for the U.S. are based on Petty and Porro (2007) and are shown in Figure 3. Supply curves in non-U.S. regions are assumed to have the same shape as those used in the U.S., but with different amounts of maximum resources. Estimates of maximum hydrothermal (conventional geothermal) resources are based on Glitnir (2007), and EGS resources in all regions are based on data provided by R. Bertani (pers. comm..; see Table 7)
<br>  <br>
<br>
Figure 3. Geothermal supply curves in 2050 for the U.S. region. The EGS technology is only included in advanced technology scenarios.
References
<references />