Introduction

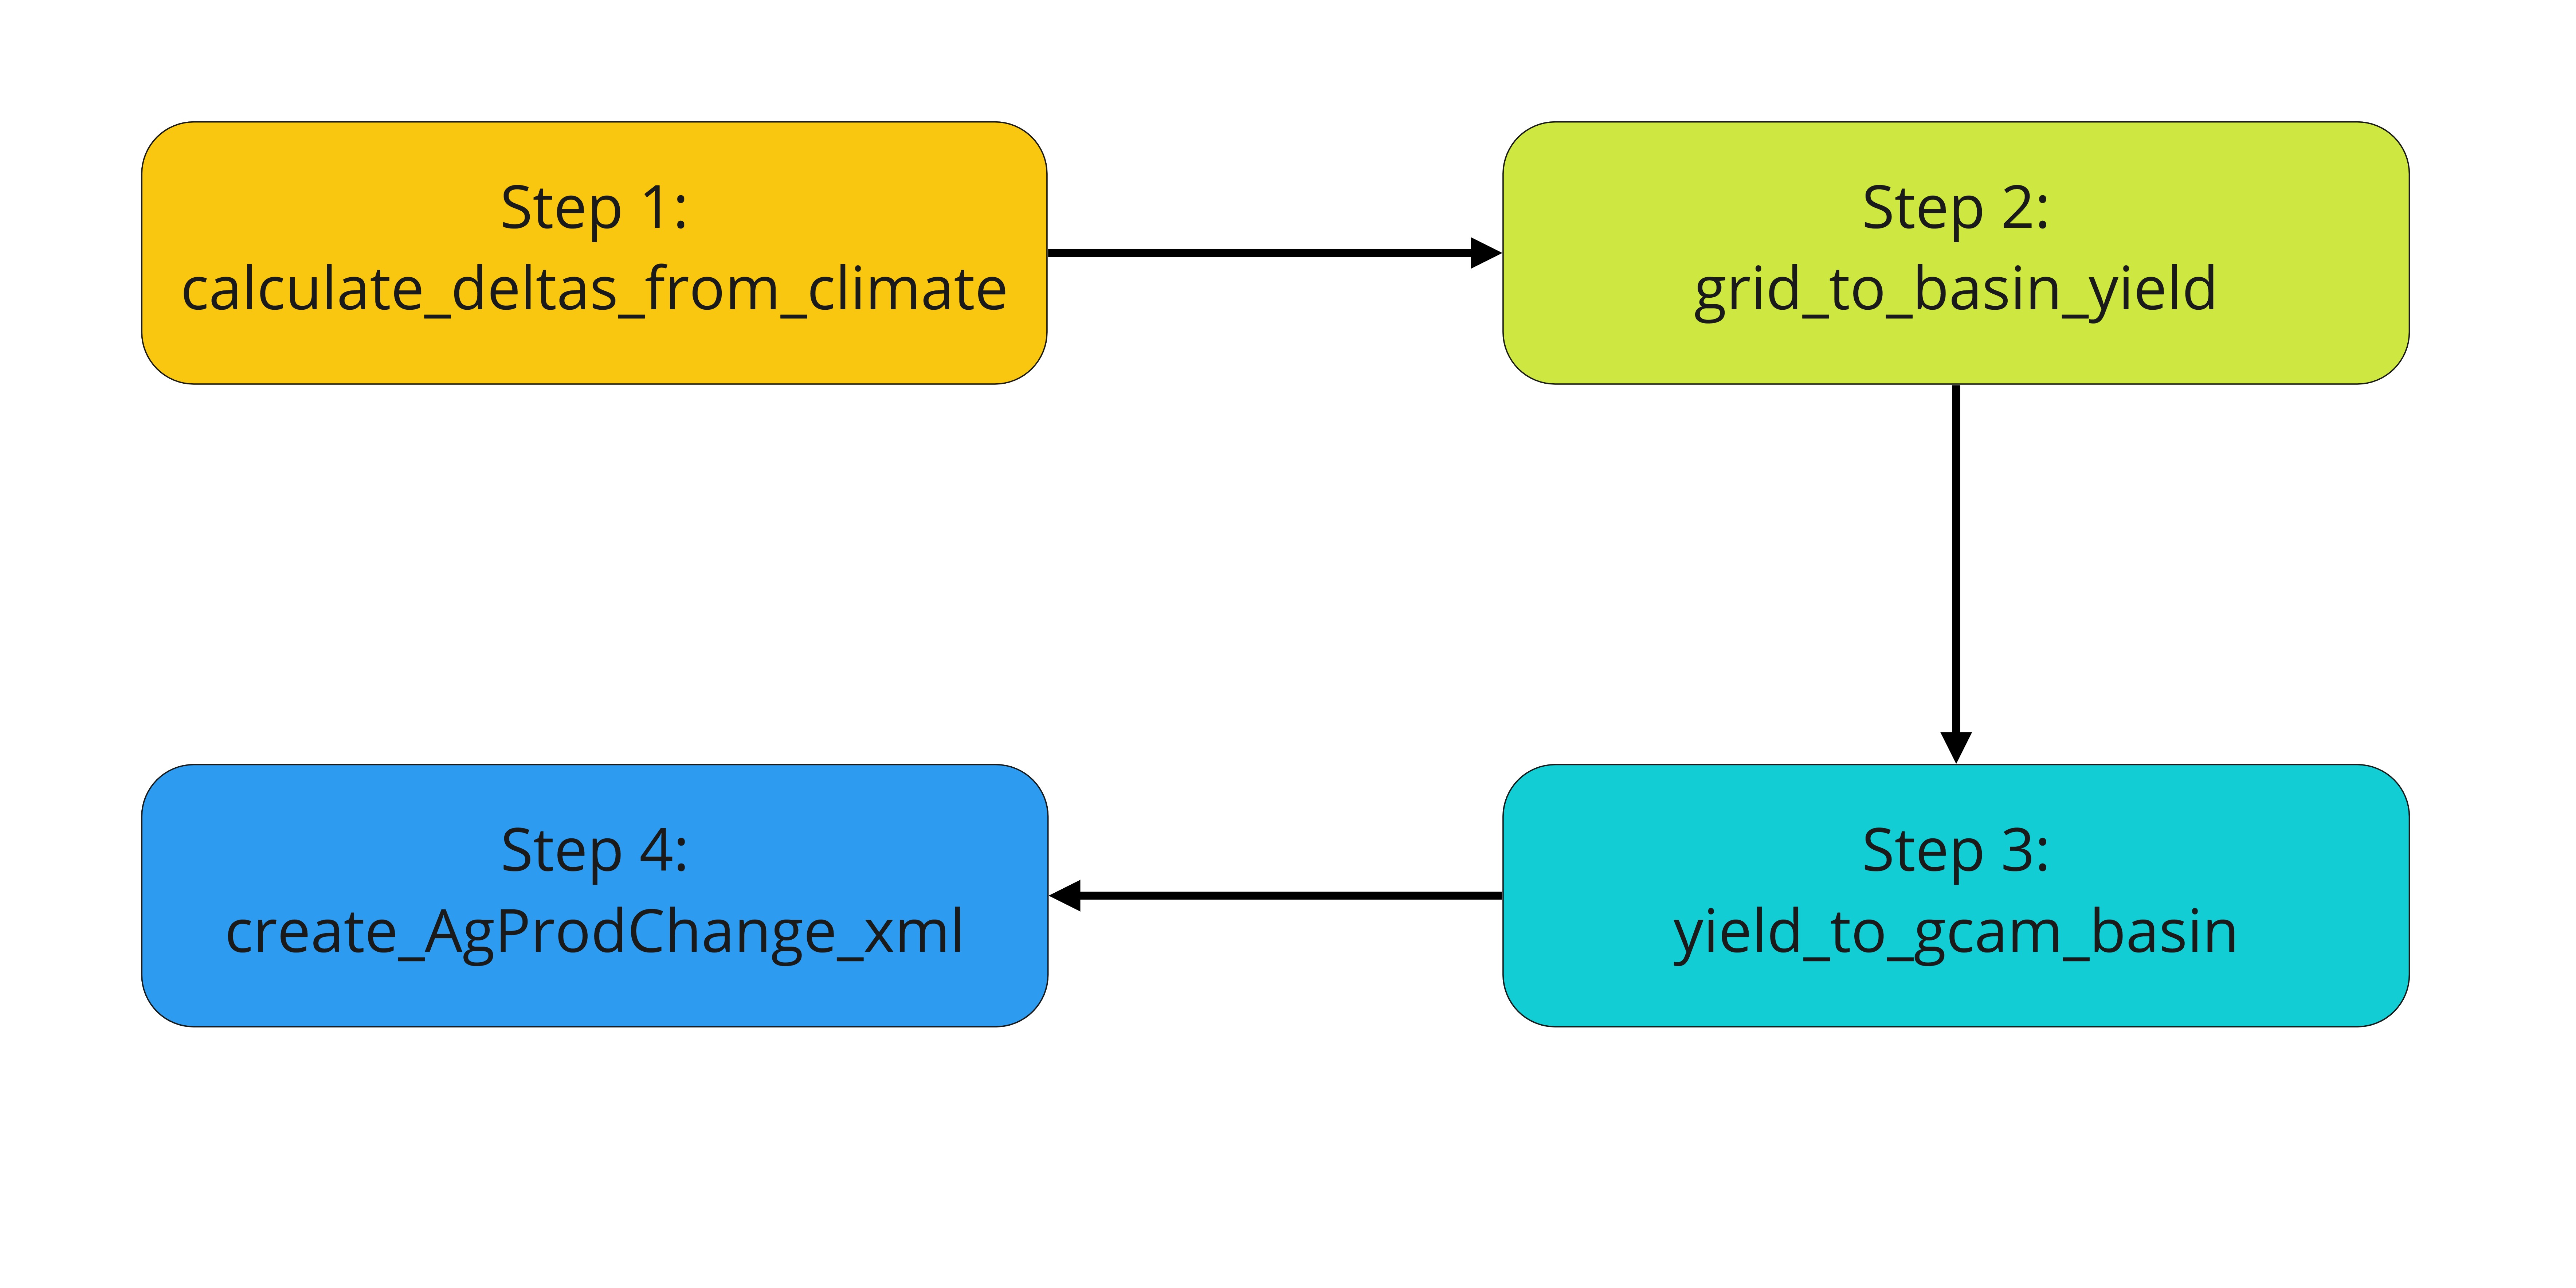
Osiris is an R package that is used to process climate impacts on agricultural yields for the Global Change Analysis Model (GCAM). This package is a modular data pipeline that consists of four steps that take gridded crop yield data from existing emulators and transforms them into agricultural yield impacts for GCAM commodities. The four functions are run in series as follows, with a detailed workflow below:
- calculate_deltas_from_climate(): obtain precipitation and temperature data for each crop and irrigation type, as well as the difference relative to baseline average
- grid_to_basin_yield(): use global gridded crop model emulator output to generate crop yield and aggregate to GCAM basins
- yield_to_gcam_basin(): convert agricultural yield data to multipliers for each GCAM commodity-irrigation-basin
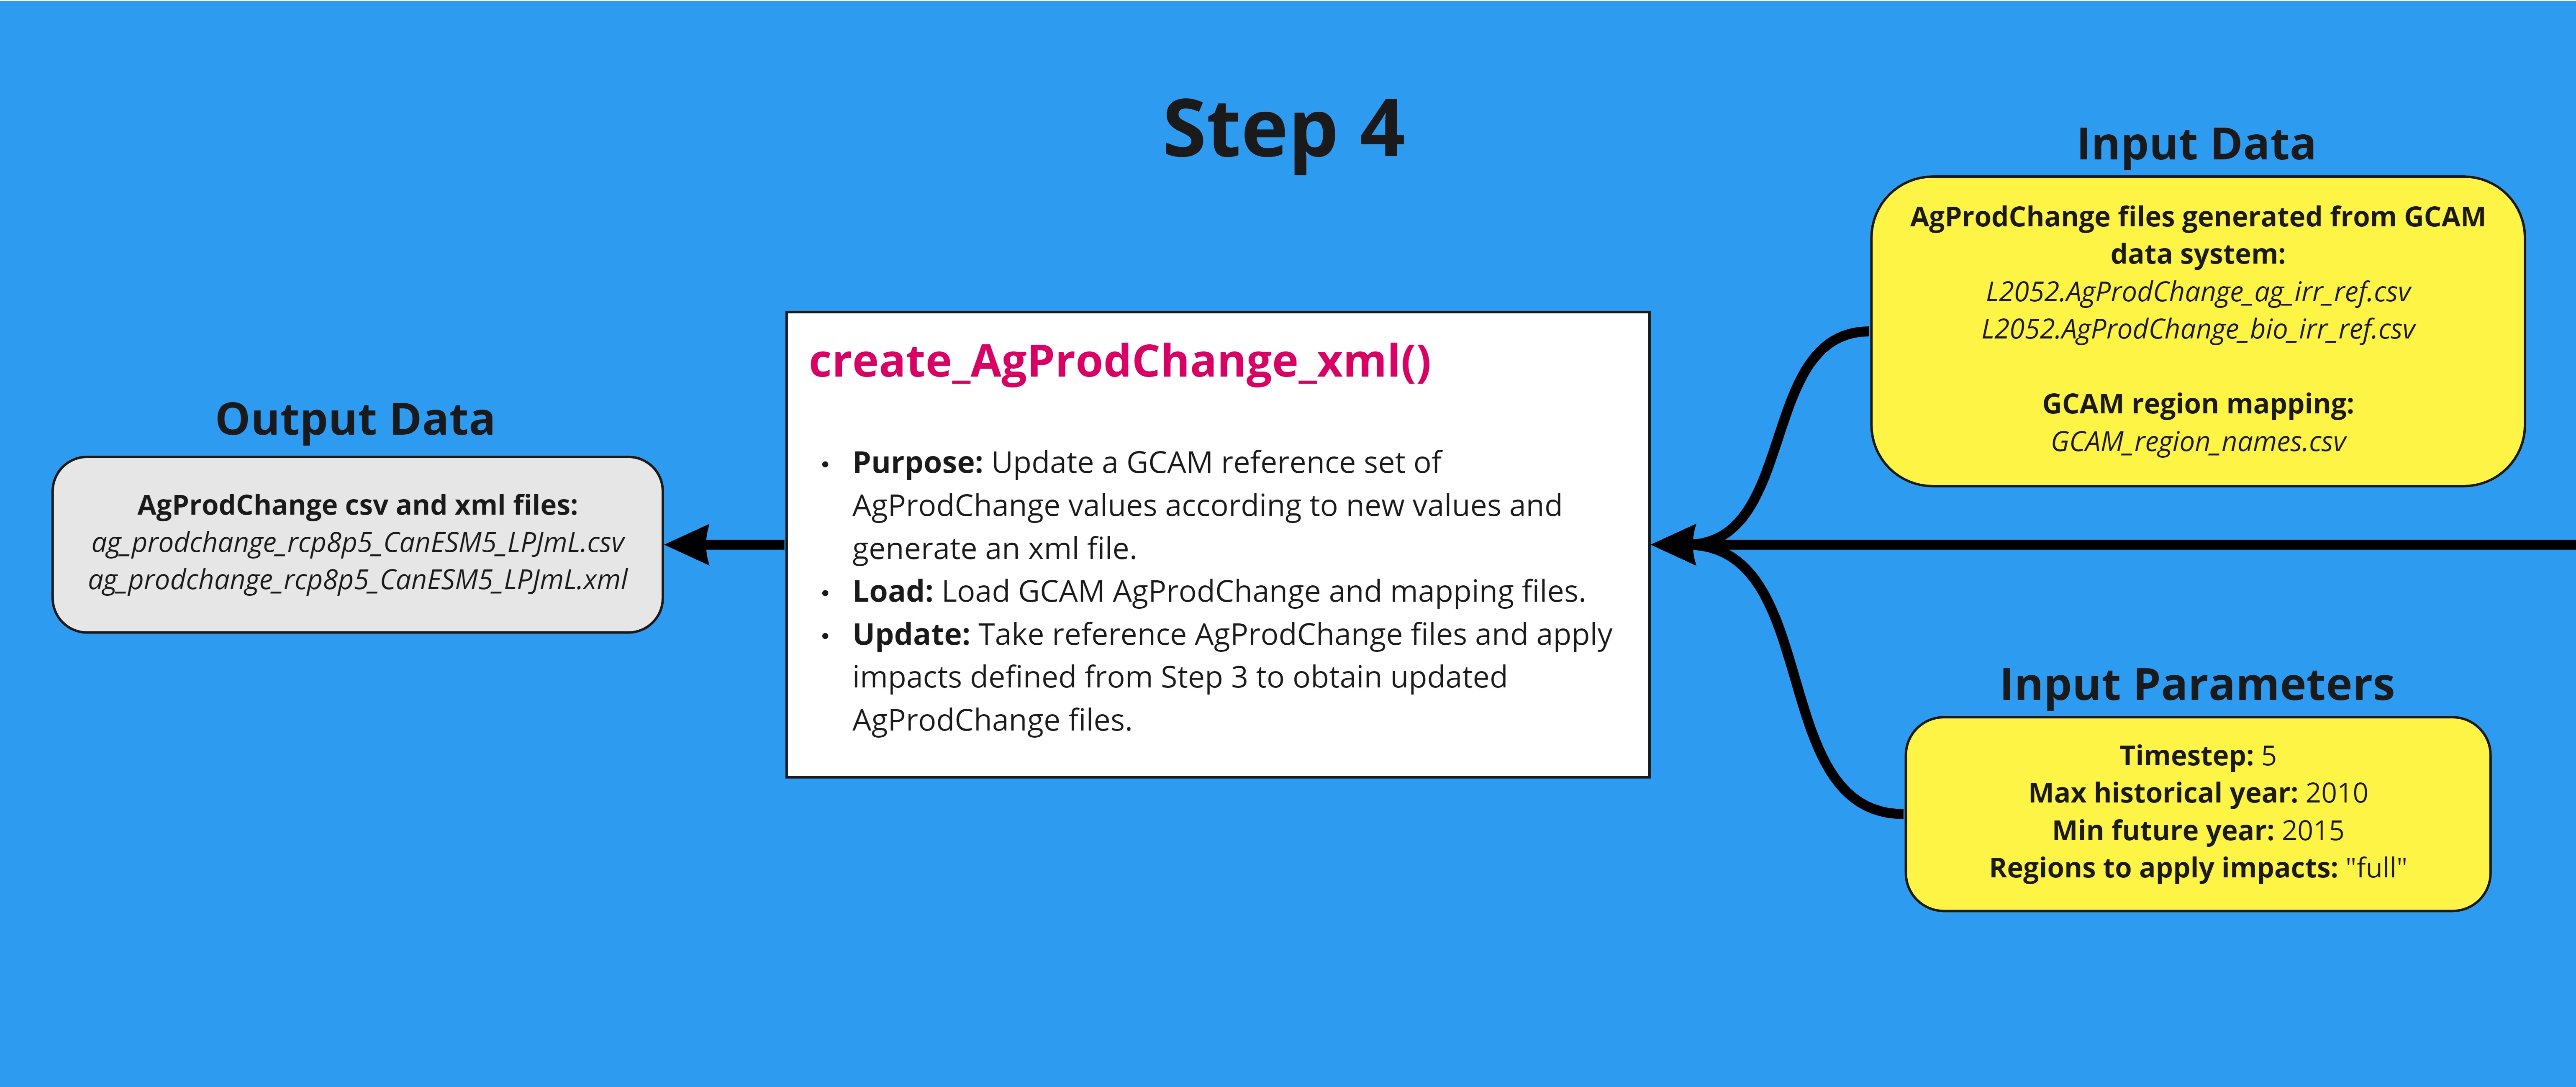
- create_AgProdChange_xml(): apply multipliers to AgProdChange from GCAM reference and obtain a new file in xml format
Workflow Summary
Workflow Details

Install
- Download and install:
- R (https://www.r-project.org/)
- R studio (https://www.rstudio.com/) (Optional)
- In R or R studio:
install.packages("devtools")
devtools::install_github("JGCRI/osiris")
Additional steps for UBUNTU from a terminal
sudo add-apt-repository ppa:ubuntugis/ppa
sudo apt-get update
sudo apt-get install -y libcurl4-openssl-dev libssl-dev libxml2-dev libudunits2-dev libavfilter-dev  libmagick++-dev
Additional steps for MACOSX from a terminal
brew install pkg-configDownload supplement
To run the Osiris package, download the supplementary data which
includes the climate data files, mapping files, crop emulator files,
etc. Note that the climate_data folder currently contains
temperature and precipitation files specifically from the CanESM5 model.
The Osiris package was originally designed to function with the CanESM5
data. If a different set of climate data are used, it may need to be
regridded to conform to the same format as CanESM5. Feel free to start
an issue on the GitHub page or contact the author (Hamza) for help
needed to integrate your climate data into Osiris.
The get_example_data() function takes in two arguments,
write_dir (default is the current directory) and
data_link (default is the zenodo link to the Osiris
data).
After the supplementary data is installed, set
data_folder to the location of the folder.
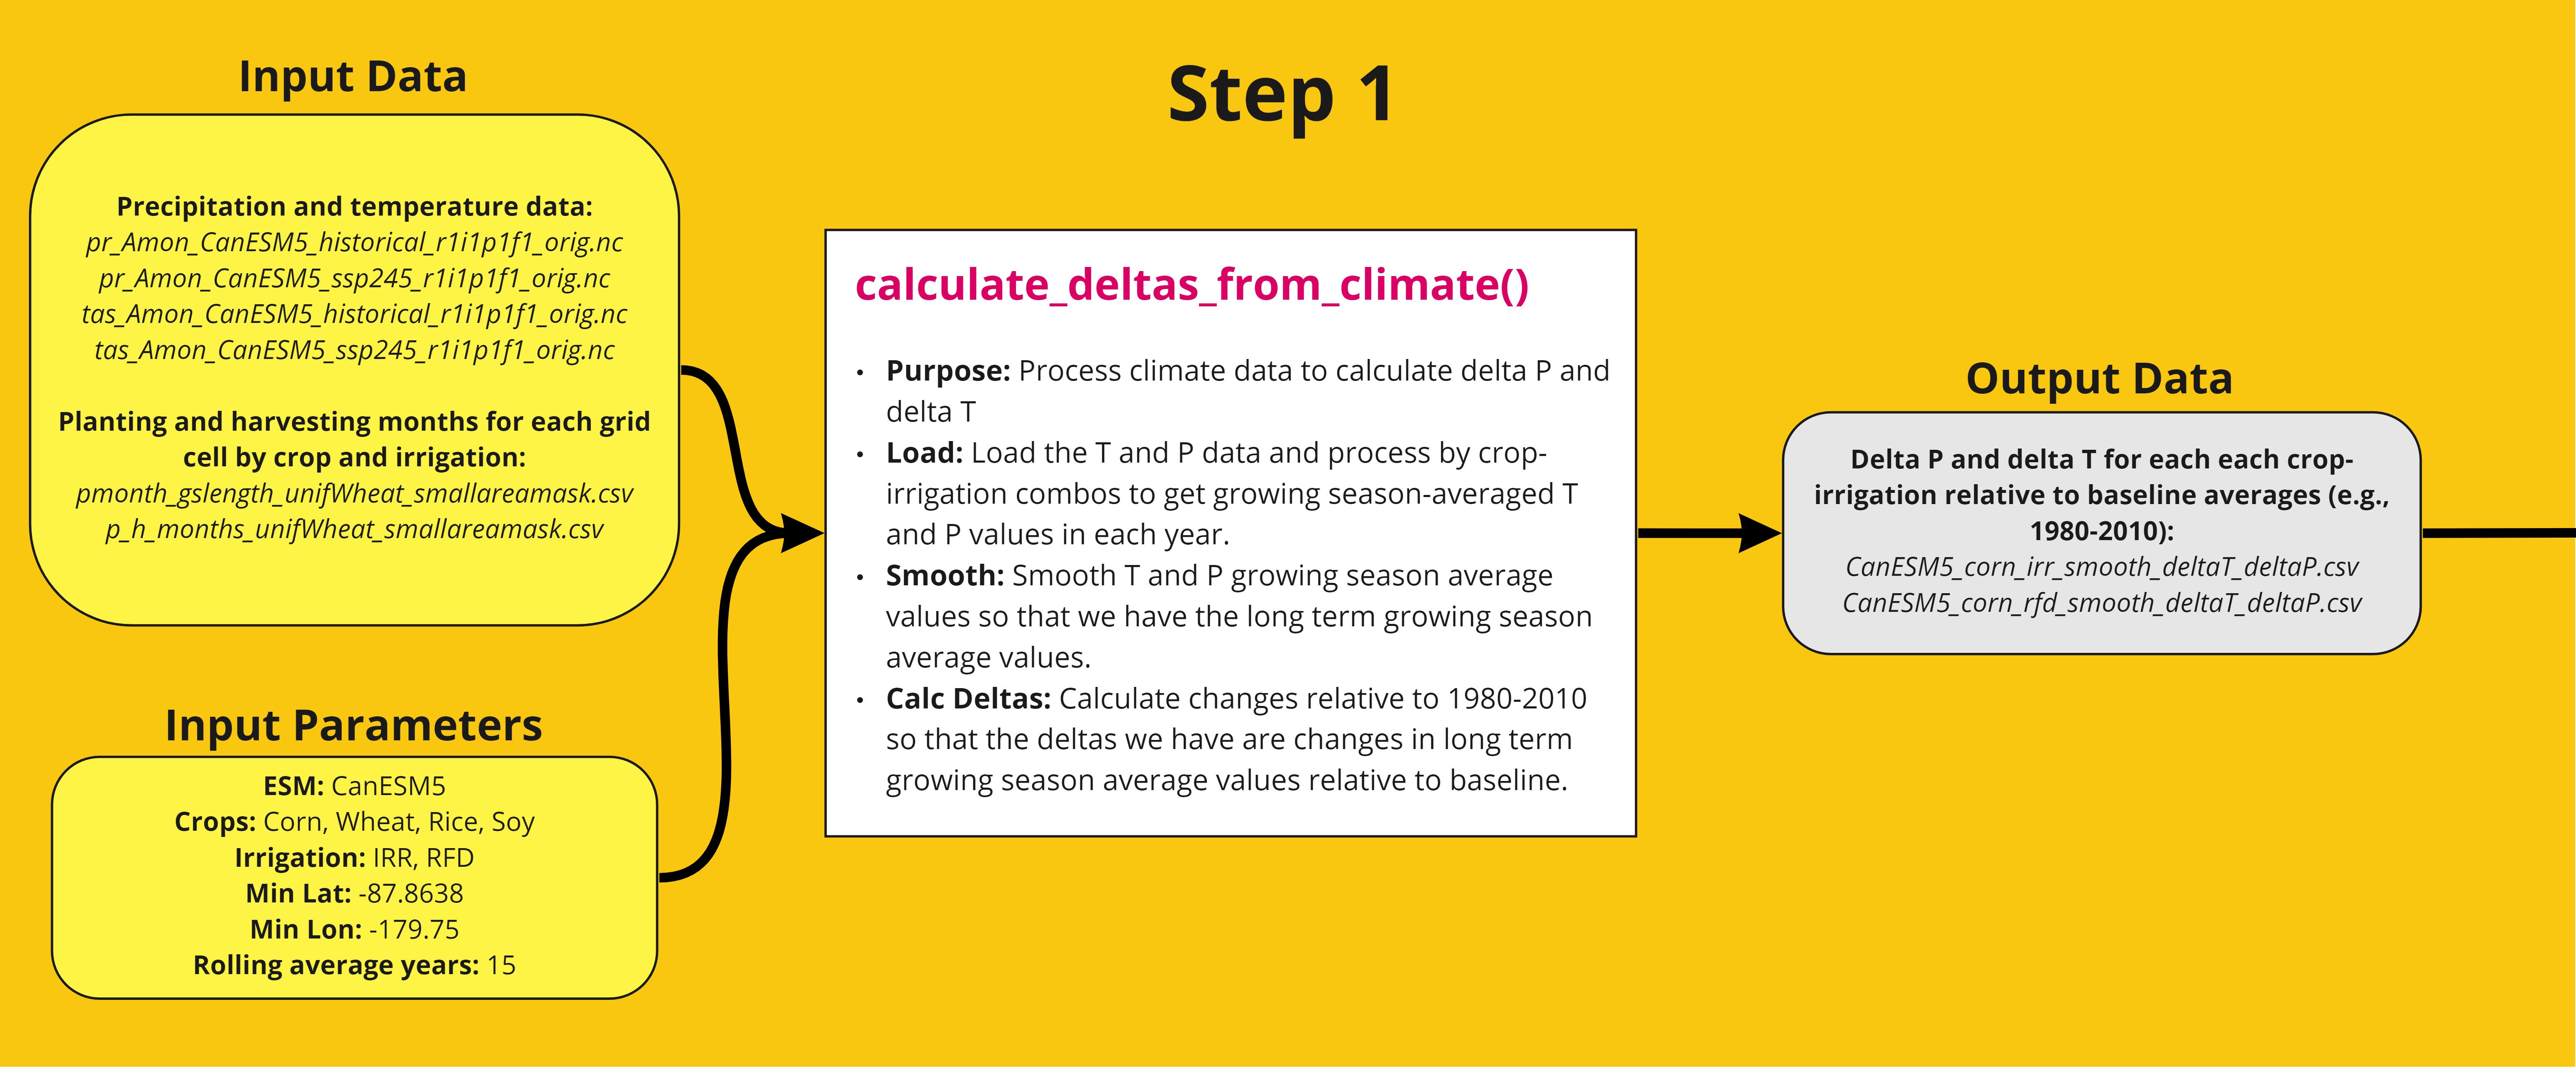
Step 1
The first step in the workflow processes climate data (see table for source) for each crop and irrigation type. The growing season-average precipitation and temperature data is calculated and smoothed to obtain the long term growing season average values. Then the change relative to 1980-2010 is calculated to obtain changes in long term growing season average values relative to baseline. A detailed workflow is shown below. The function can be tested using the example script.
Table
| File | Description | Reference/Source |
|---|---|---|
|
pr_Amon_CanESM5_historical_r1i1p1f1.nc
tas_Amon_CanESM5_historical_r1i1p1f1.nc |
Netcdf of historical and future projected global temperature (K) and precipitation (kg m-2 s-1). Users may use own files. |
Swart et al., 2019 (historical: https://www.wdc-climate.de/ui/cmip6?input=CMIP6.CMIP.CCCma.CanESM5.historical
ssp245: https://www.wdc-climate.de/ui/cmip6?input=CMIP6.ScenarioMIP.CCCma.CanESM5.ssp245 ssp585: https://www.wdc-climate.de/ui/cmip6?input=CMIP6.ScenarioMIP.CCCma.CanESM5.ssp585) |
|
pr_Amon_CanESM5_ssp245_r1i1p1f1.nc
tas_Amon_CanESM5_ssp245_r1i1p1f1.nc |
||
|
pr_Amon_CanESM5_ssp585_r1i1p1f1.nc
tas_Amon_CanESM5_ssp585_r1i1p1f1.nc |
||
| pmonth_gslength_unifWheat_smallareamask.csv | Data for planting and harvesting months, and growing season length. Default files taken from previous study. These can be updated for other growing season assumptions. | Snyder, 2018 (https://zenodo.org/record/1415487) |
| p_h_months_unifWheat_smallareamask.csv |
Example Script
library(osiris)
# Step 1: calculate_deltas_from_climate
osiris::calculate_deltas_from_climate(
climate_dir = paste0(data_folder,"/climate_data"),
write_dir = paste0(data_folder,"/outputs_calculate_delta_from_climate"),
monthly_growing_season = paste0(data_folder,"/growing_seasons/pmonth_gslength_unifWheat_smallareamask.csv"),
monthly_harvest_season = paste0(data_folder,"/growing_seasons/p_h_months_unifWheat_smallareamask.csv"),
growing_season_dir = paste0(data_folder,"/outputs_growing_season_climate_data"),
esm_name = "CanESM5",
crops = c("Corn", "Wheat", "Rice", "Soy"),
irrigation_rainfed = c("IRR", "RFD"),
minlat = -87.8638,
minlon = -179.75,
rollingAvgYears = 1,
tas_historical = "tas_Amon_CanESM5_historical_r1i1p1f1_gn_201001-201501.nc",
tas_projected = "tas_Amon_CanESM5_ssp245_r1i1p1f1_gn_201501-202101.nc",
pr_historical = "pr_Amon_CanESM5_historical_r1i1p1f1_gn_201001-201501.nc",
pr_projected = "pr_Amon_CanESM5_ssp245_r1i1p1f1_gn_201501-202101.nc",
historical_start_year = 2010,
projection_start_year = 2015
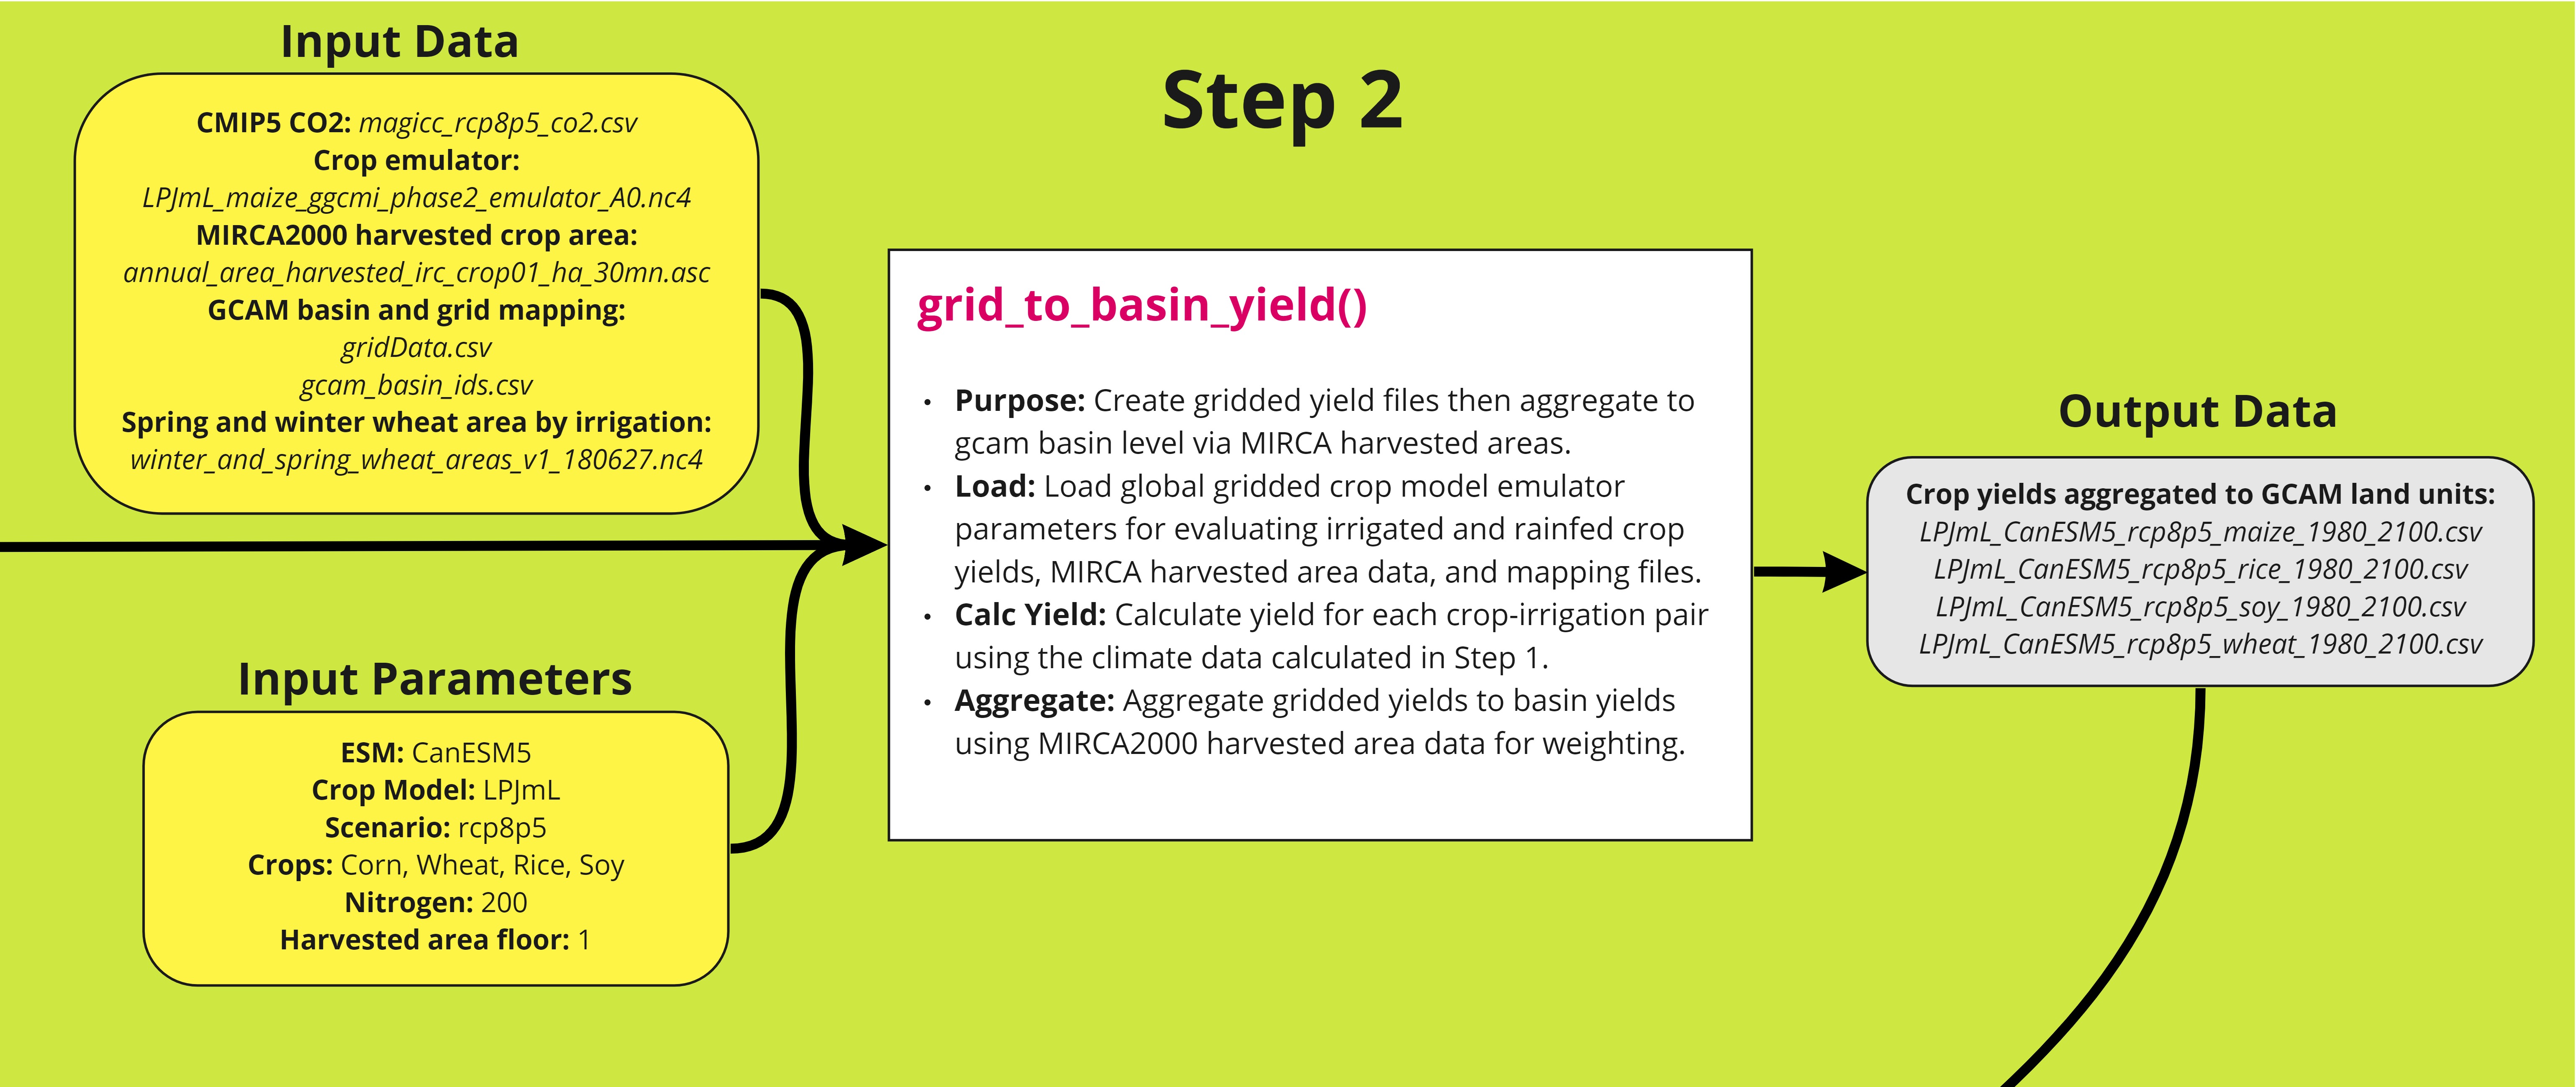
)Step 2
The second step in the workflow uses the output from a global gridded crop model emulator to generate crop yield that is aggregated to GCAM basins. The winter and spring wheat area file (see table) is used to unify the emulator data for spring and winter wheat into a single grid. The crop yield is calculated using a polynomial equation (Franke et al., 2020) based on the precipitation and temperature data obtained from Step 1. The yields are then aggregated to GCAM basins using MIRCA2000 harvested area. A detailed workflow is shown below. The function can be tested using the example script.
Table
| File | Description | Reference/Source | |
|---|---|---|---|
| magicc_rcp8p5_co2.csv | Timeseries of atmospheric CO2 concentration based on MAGICC6 model and RCP8.5 scenario. Default file. | Snyder, 2018 (https://zenodo.org/record/1415487) | |
|
LPJmL_maize_ggcmi_phase2_emulator_A0.nc4
LPJmL_rice_ggcmi_phase2_emulator_A0.nc4 LPJmL_soy_ggcmi_phase2_emulator_A0.nc4 LPJmL_spring_wheat_ggcmi_phase2_emulator_A0.nc4 LPJmL_winter_wheat_ggcmi_phase2_emulator_A0.nc4 |
Netcdf files of LPJmL crop model emulator polynomial parameters (0.5 degree global resolution). This emulator is geared towards the AgMIP GGCMI Phase 2 style of emulators and has a yield response function for corn, rice, soy and wheat. This is the default emulator. | Franke, 2019 (https://doi.org/10.5281/zenodo.3592453) | |
|
annual_area_harvested_irc_crop01_ha_30mn.asc ⋮ annual_area_harvested_irc_crop26_ha_30mn.asc annual_area_harvested_rfc_crop01_ha_30mn.asc ⋮ annual_area_harvested_rfc_crop26_ha_30mn.asc |
MIRCA 2000 - global annual harvested area grids for 26 irrigated and rainfed crops. Default files. |
Portmann et al., 2010 (https://doi.org/10.1029/2008GB003435) data: https://www.uni-frankfurt.de/45218031/Data_download_center_for_MIRCA2000 |
|
|
gridData.csv gcam_basin_ids.csv |
Mapping files derived from gcamdata files. Default files. | Bond-Lamberty, 2019 (https://openresearchsoftware.metajnl.com/articles/10.5334/jors.232) | |
| winter_and_spring_wheat_areas_v1_180627.nc4 | Netcdf file of a mask assigning harvested wheat areas to winter or spring wheat. This is used to calculate both winter and spring wheat. Default file. | Müller, 2020 (https://doi.org/10.5281/zenodo.3773827) | |
Example Script
library(osiris)
# Step 2: grid_to_basin_yield
osiris::grid_to_basin_yield(
carbon = paste0(data_folder,"/yield_response_inputs/magicc_rcp8p5_co2.csv"),
weight_floor_ha = 1,
emulator_dir = paste0(data_folder,"/yield_response_fcns/ggcmi_phase2"),
input_dir = paste0(data_folder,"/outputs_calculate_delta_from_climate"),
area_dir = paste0(data_folder,"/area_data"),
basin_grid = paste0(data_folder,"/mapping_data/gridData.csv"),
basin_id = paste0(data_folder,"/mapping_data/gcam_basin_ids.csv"),
write_dir = paste0(data_folder,"/outputs_grid_to_basin_yield"),
wheat_area = paste0(data_folder,"/winter_and_spring_wheat_areas_v1_180627.nc4"),
crops = c("maize", "rice", "soy", "wheat"),
esm_name = "CanESM5",
cm_name = "LPJmL",
scn_name = "ssp245",
N = 200
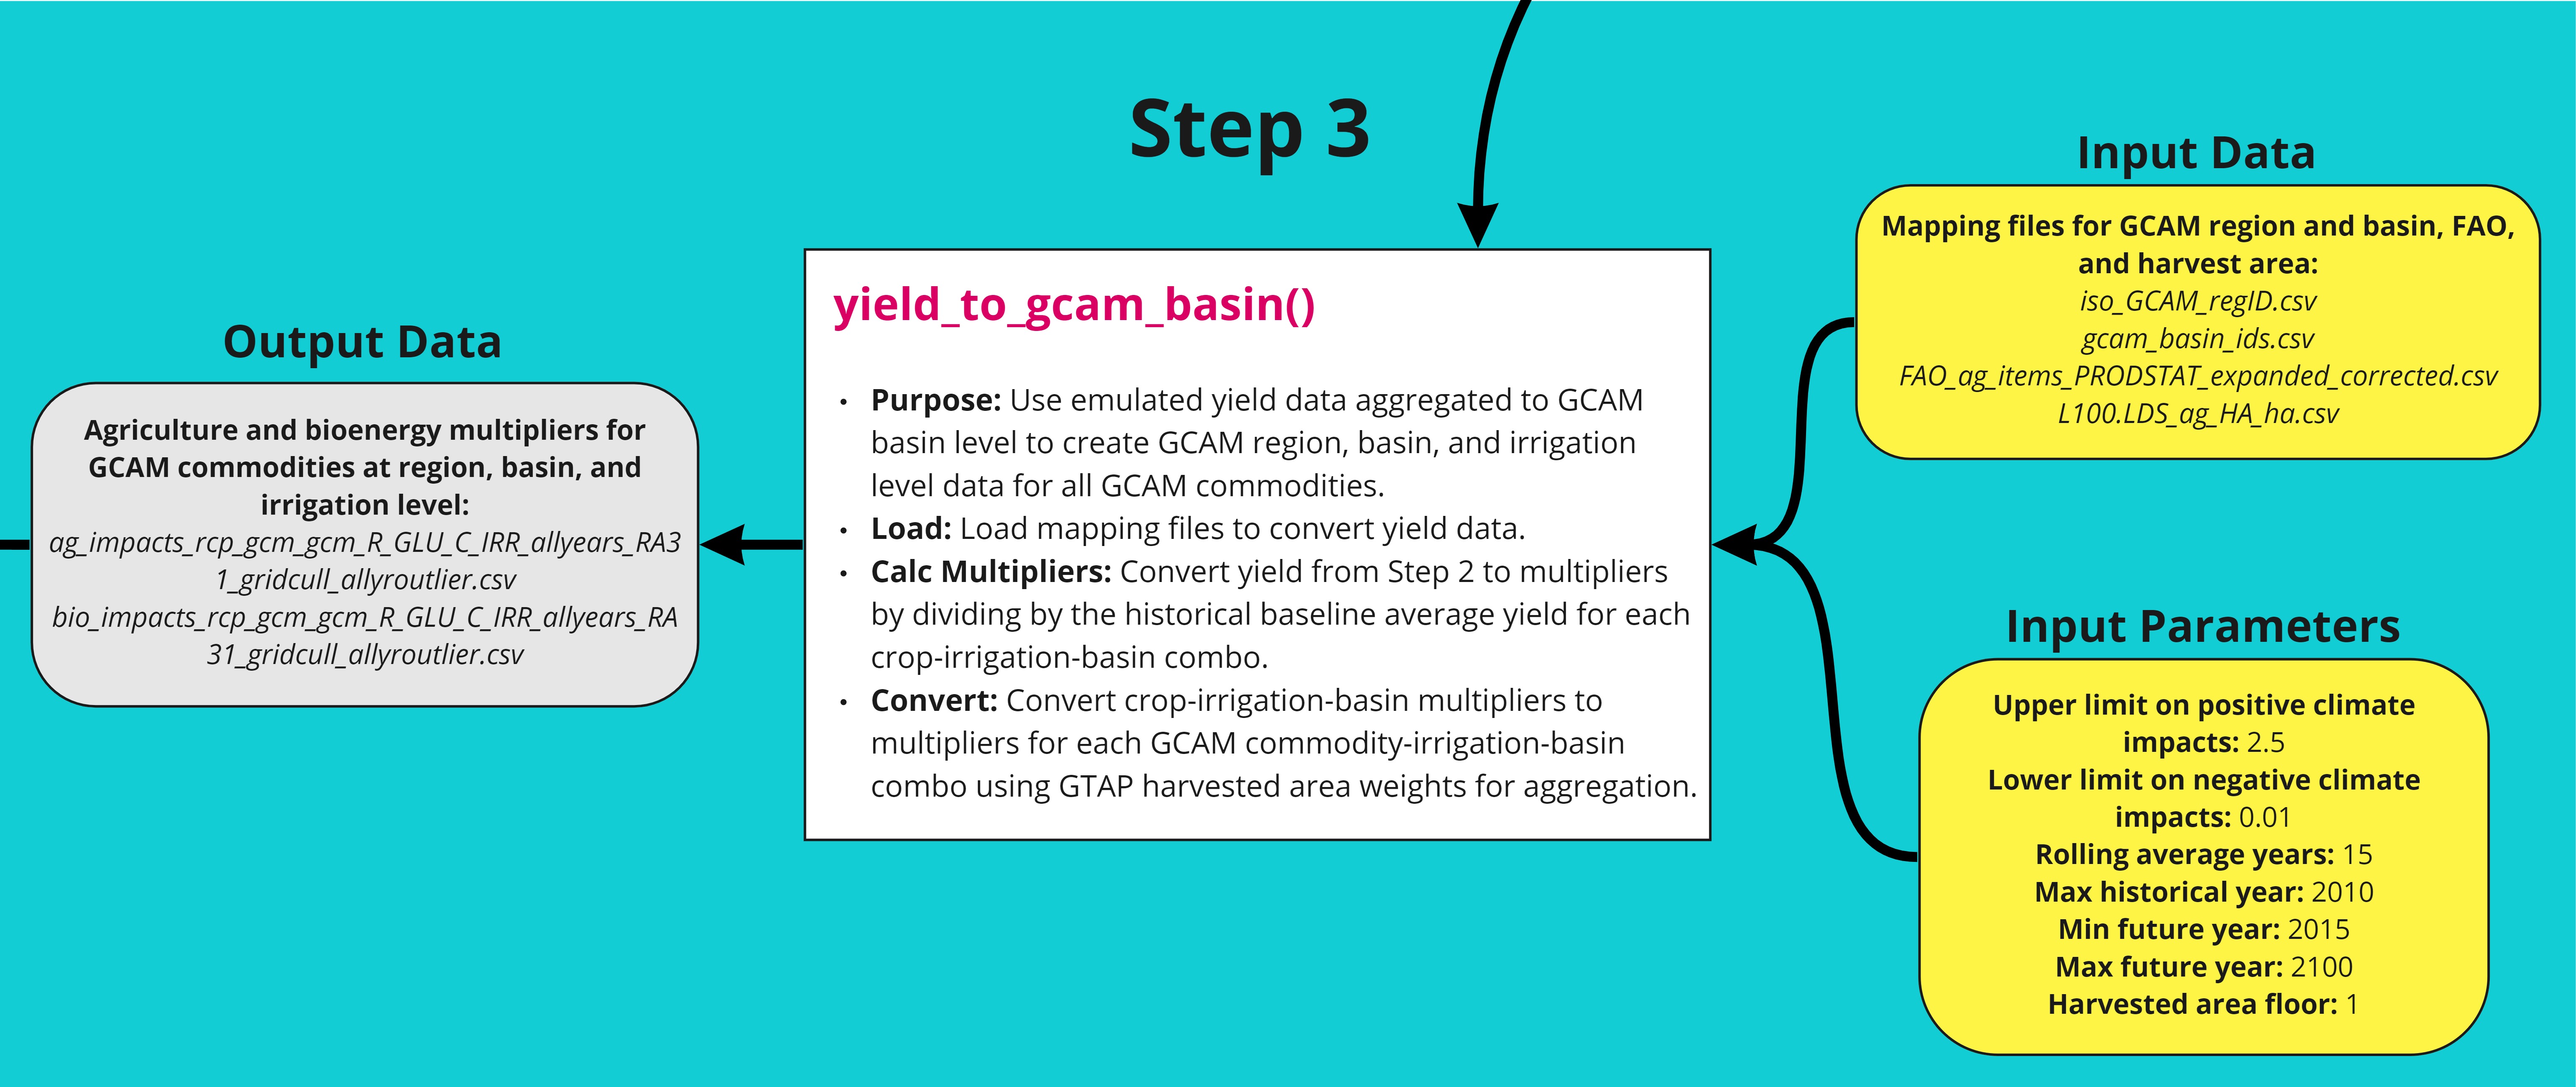
)Step 3
The third step in the workflow converts the agricultural yield data from the second step to crop-irrigation-basin multipliers, which are then converted to multipliers for each GCAM commodity-irrigation-basin based on GTAP harvested area weights. A detailed workflow is shown below. The function can be tested using the example script.
Table
| File | Description | Reference/Source |
|---|---|---|
| iso_GCAM_regID.csv | gcamdata files, essentially specific to the version of GCAM being used and does not change once the gcamdata system for that version has been built. Default files. | Snyder, 2018 (https://zenodo.org/record/1415487) |
|
gcam_basin_ids.csv FAO_ag_items_PRODSTAT_expanded_corrected.csv
L100.LDS_ag_HA_ha.csv |
Bond-Lamberty, 2019 (https://openresearchsoftware.metajnl.com/articles/10.5334/jors.232) |
Example Script
library(osiris)
# Step 3: yield_to_gcam_basin
osiris::yield_to_gcam_basin(
  write_dir = paste0(data_folder,"/outputs_yield_to_gcam_basin"),
  emulated_basin_yield_dir = paste0(data_folder,"/outputs_grid_to_basin_yield"),
  iso_GCAM_region_mapping = paste0(data_folder,"/mapping_data/iso_GCAM_regID.csv"),
  FAO_ag_mapping = paste0(data_folder,"/gcamdata_files/FAO_ag_items_PRODSTAT_expanded_corrected.csv"),
  iso_harvest_area_mapping = paste0(data_folder,"/gcamdata_files/L100.LDS_ag_HA_ha.csv"),
  iso_GCAM_basin_mapping = paste0(data_folder,"/mapping_data/gcam_basin_ids.csv"),
  esm_name = "CanESM5",
  scn_name = "ssp245",
  max_CCImult = 2.5,
  min_CCImult = 0.01,
  weight_floor_ha = 1,
  rolling_avg_years = 1,
  maxHistYear = 2015,
  minFutYear = 2015,
  maxFutYear = 2020,
  extrapolate_to = NULL
)
Step 4
The fourth step in the workflow applies the multipliers generated in the third step to GCAM reference AgProdChange and creates an updated file in xml format. A detailed workflow is shown below. The function can be tested using the example script.
Table
| File | Description | Reference/Source |
|---|---|---|
|
L2052.AgProdChange_ag_irr_ref.csv L2052.AgProdChange_bio_irr_ref.csv GCAM_region_names.csv |
gcamdata files, essentially specific to the version of GCAM being used and does not change once the gcamdata system for that version has been built. Default files. | Bond-Lamberty, 2019 (https://openresearchsoftware.metajnl.com/articles/10.5334/jors.232) |
Example Script
library(osiris)
# Step 4: create_AgProdChange_xml
osiris::create_AgProdChange_xml(
  write_dir = paste0(data_folder,"/outputs_create_AgProdChange_xml"),
  esm_name = 'CanESM5',
  scn_name = 'ssp245',
  ssp = 'ssp5',
  ag_irr_ref = paste0(data_folder,"/reference_agprodchange/L2052.AgProdChange_irr_high.csv"),
  bio_irr_ref = paste0(data_folder,"/reference_agprodchange/L2052.AgProdChange_bio_irr_ref.csv"),
  ag_impacts = paste0(data_folder,"/outputs_yield_to_gcam_basin/ag_impacts_CanESM5_ssp245_rcp_gcm_gcm_R_GLU_C_IRR_allyears_RA3_gridcull_allyroutlier.csv"),
  bio_impacts = paste0(data_folder,"/outputs_yield_to_gcam_basin/bio_impacts_CanESM5_ssp245_rcp_gcm_gcm_R_GLU_C_IRR_allyears_RA3_gridcull_allyroutlier.csv"),
  GCAM_region_mapping = paste0(data_folder,"/mapping_data/GCAM_region_names.csv"),
  timestep = 5,
  maxHistYear = 2010,
  minFutYear = 2015,
  appliedto = "full"
)