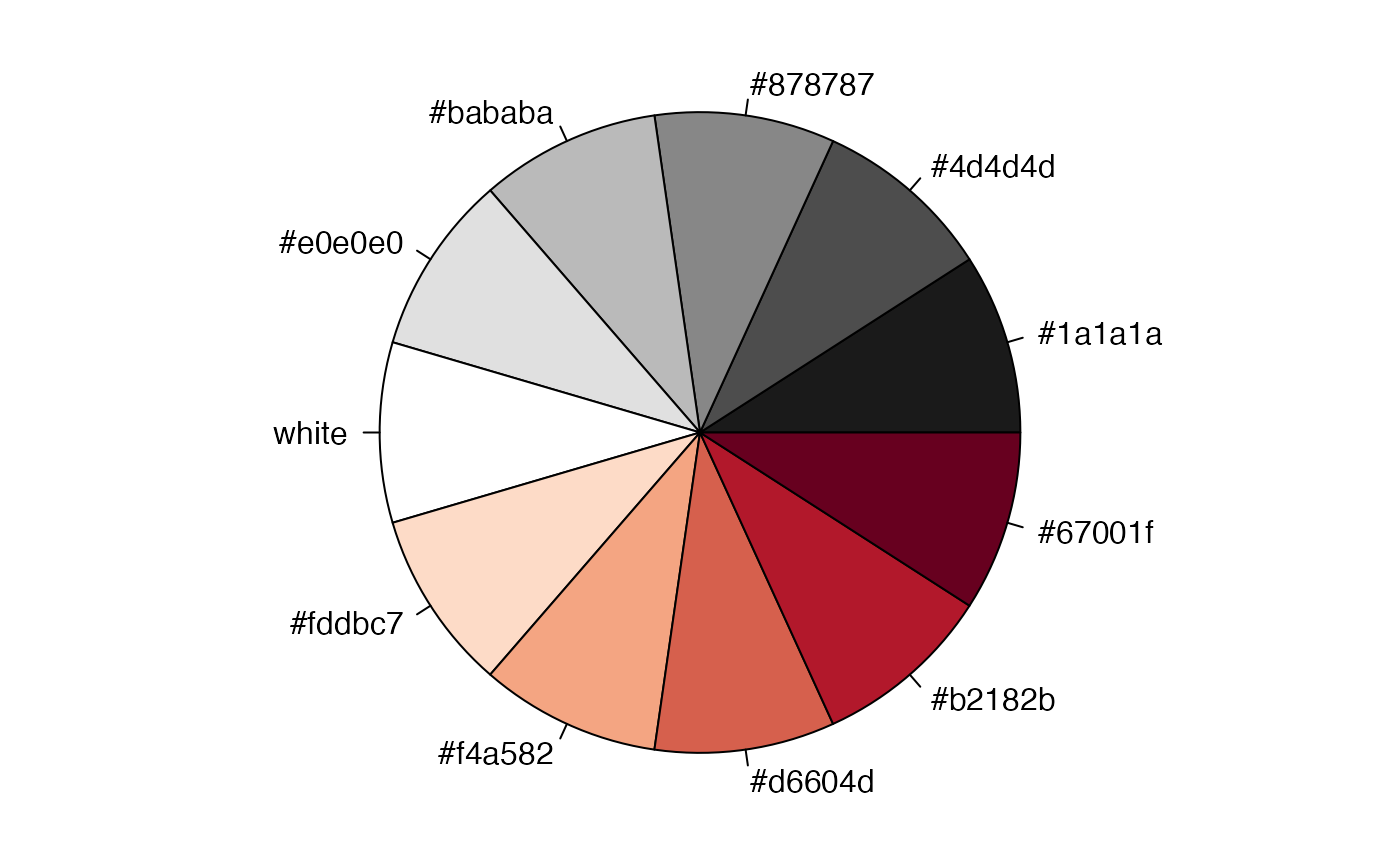
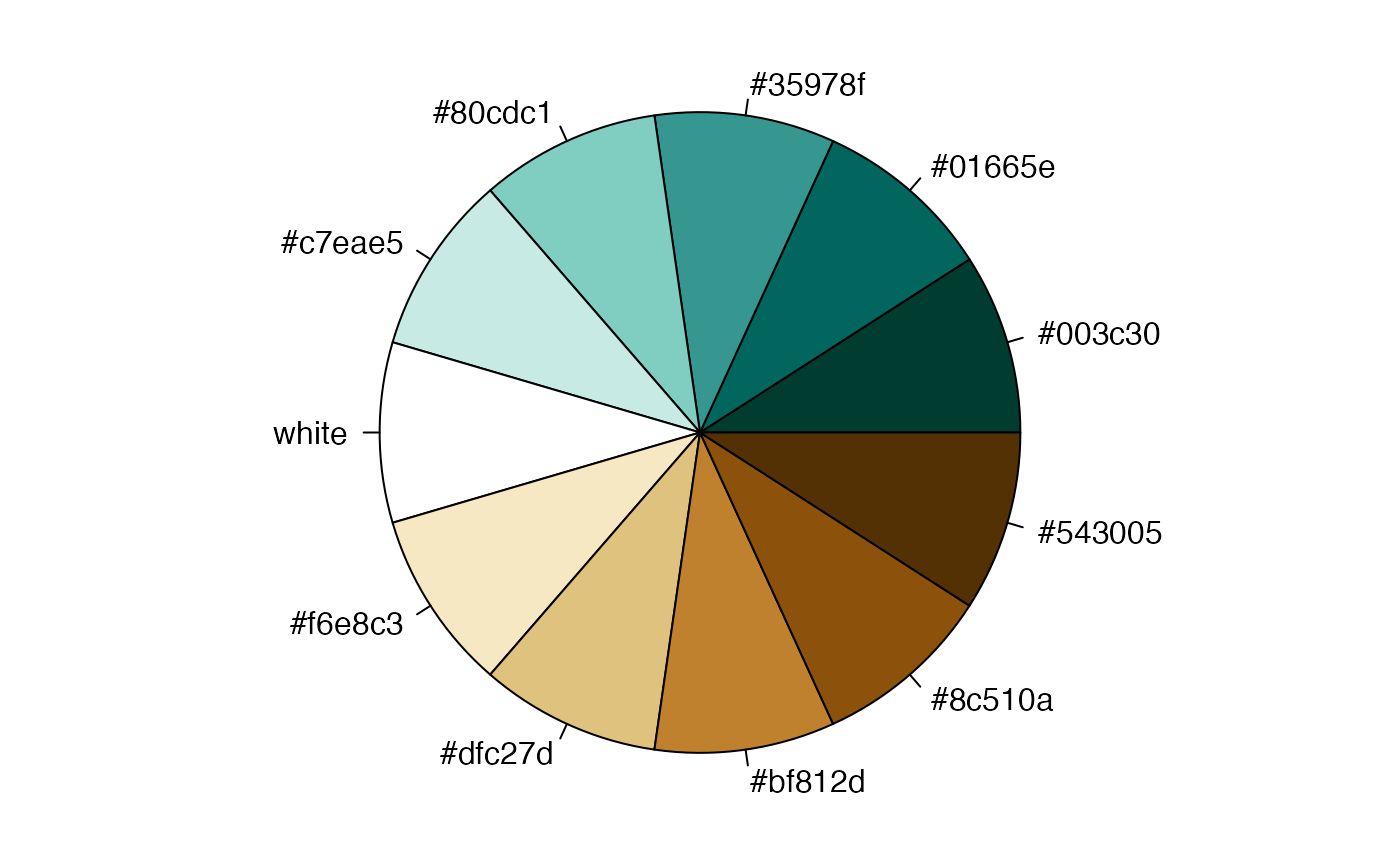
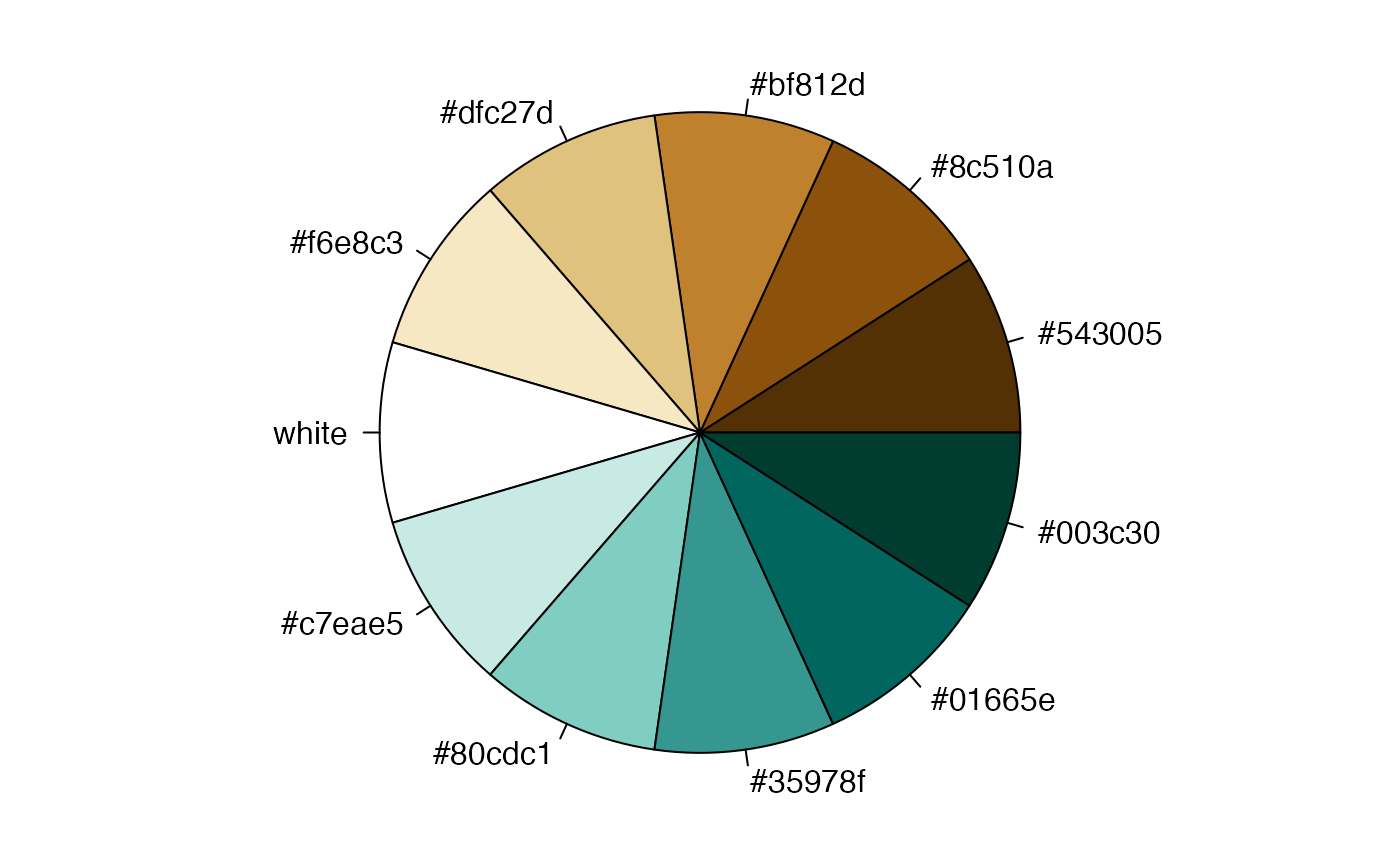
Available Palettes
library(jgcricolors)
# See all available color palettes
names(jgcricol())
#> [1] "pal_all" "pal_16" "pal_seq" "pal_basic"
#> [5] "pal_hot" "pal_green" "pal_wet" "pal_div_wet"
#> [9] "pal_div_RdBl" "pal_div_BlRd" "pal_div_GnBr" "pal_div_BrGn"
#> [13] "pal_div_BluRd" "pal_div_RdBlu" "pal_sankey" "pal_spectral"
#> [17] "pal_scarcityCat"
# Load a color palette
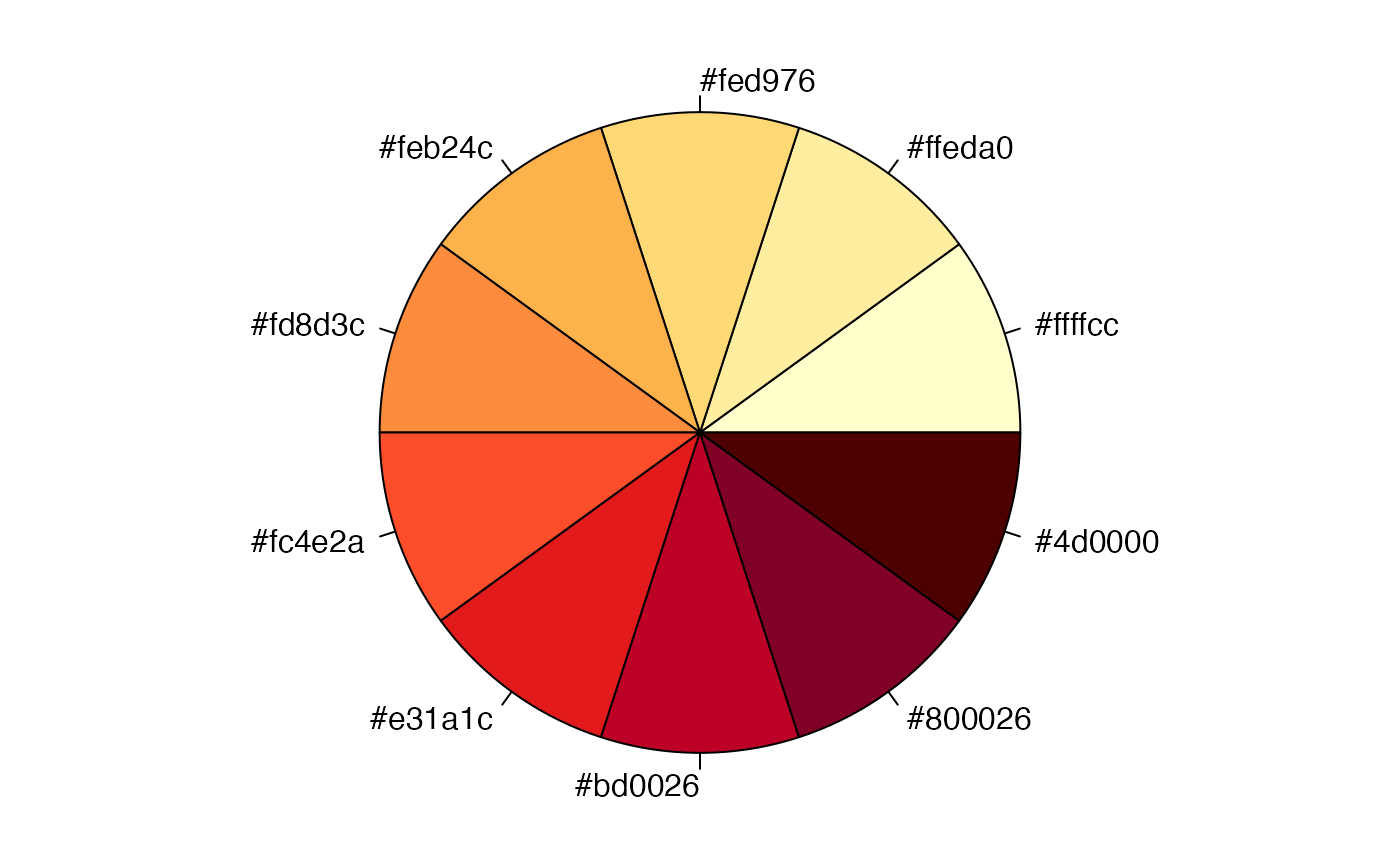
mypal1 <- jgcricol()$pal_basic # To load values only
mypal2 <- jgcricol("pal_basic") # To see an example piechart and values
JGCRI Colors (pal_all)
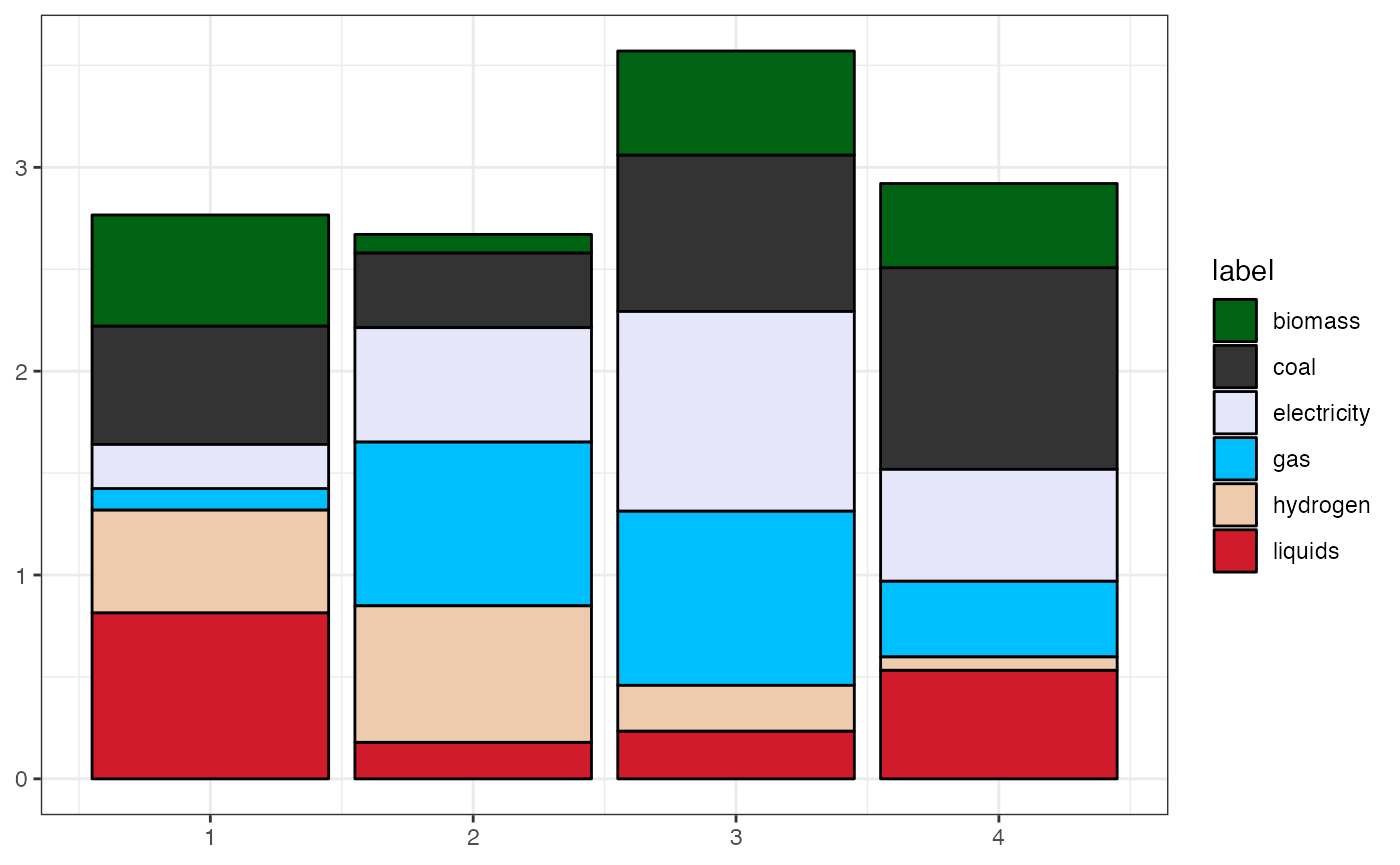
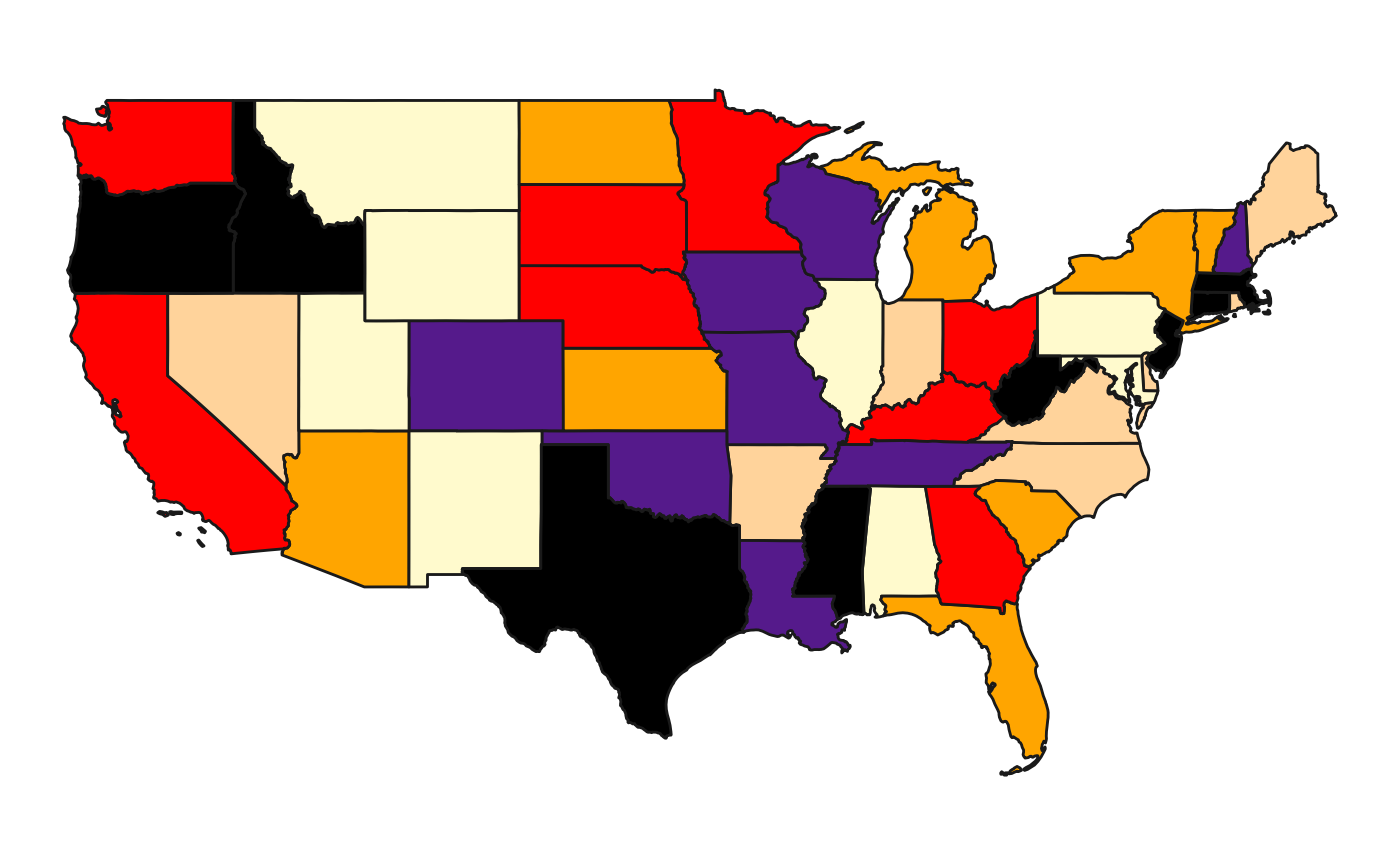
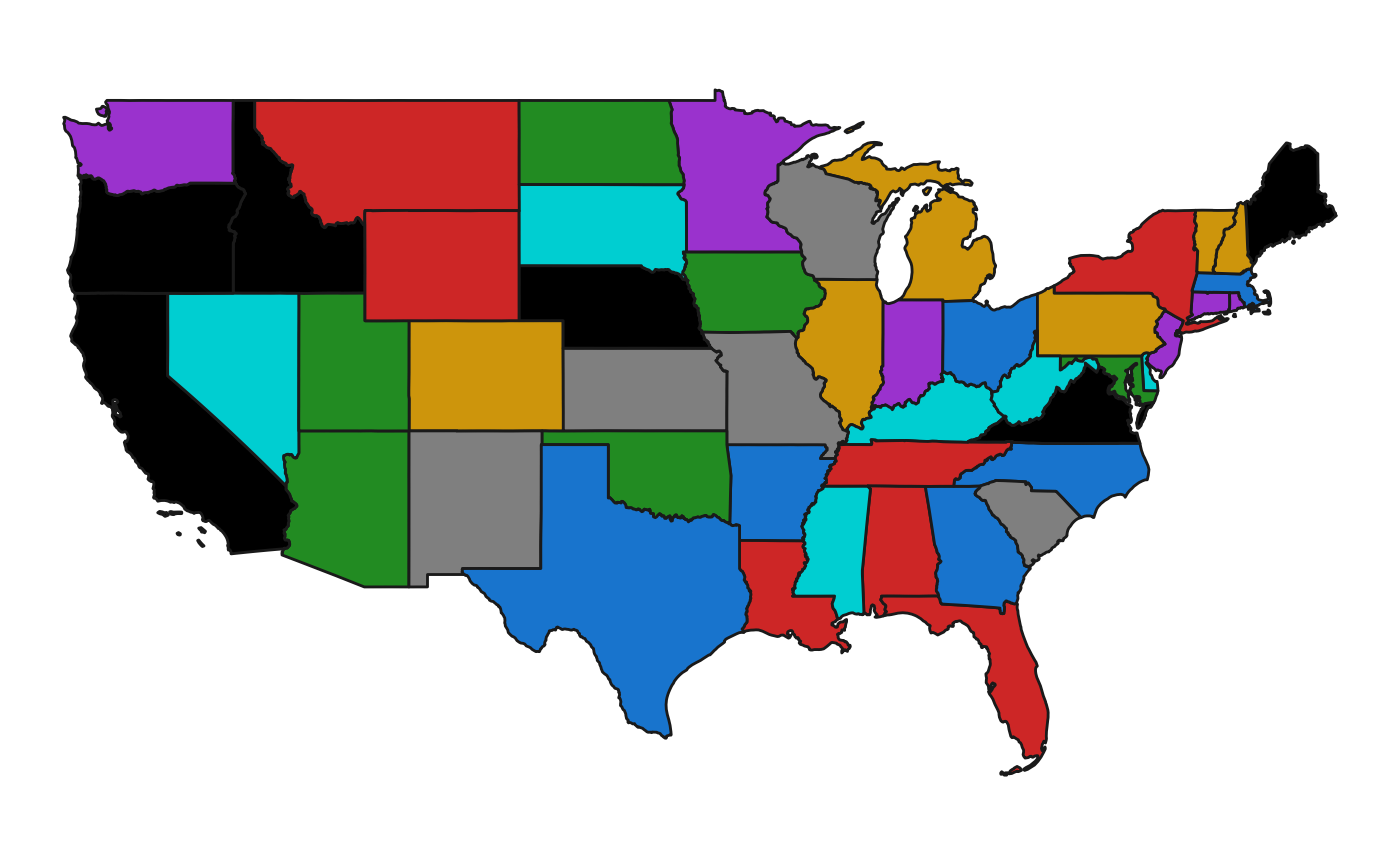
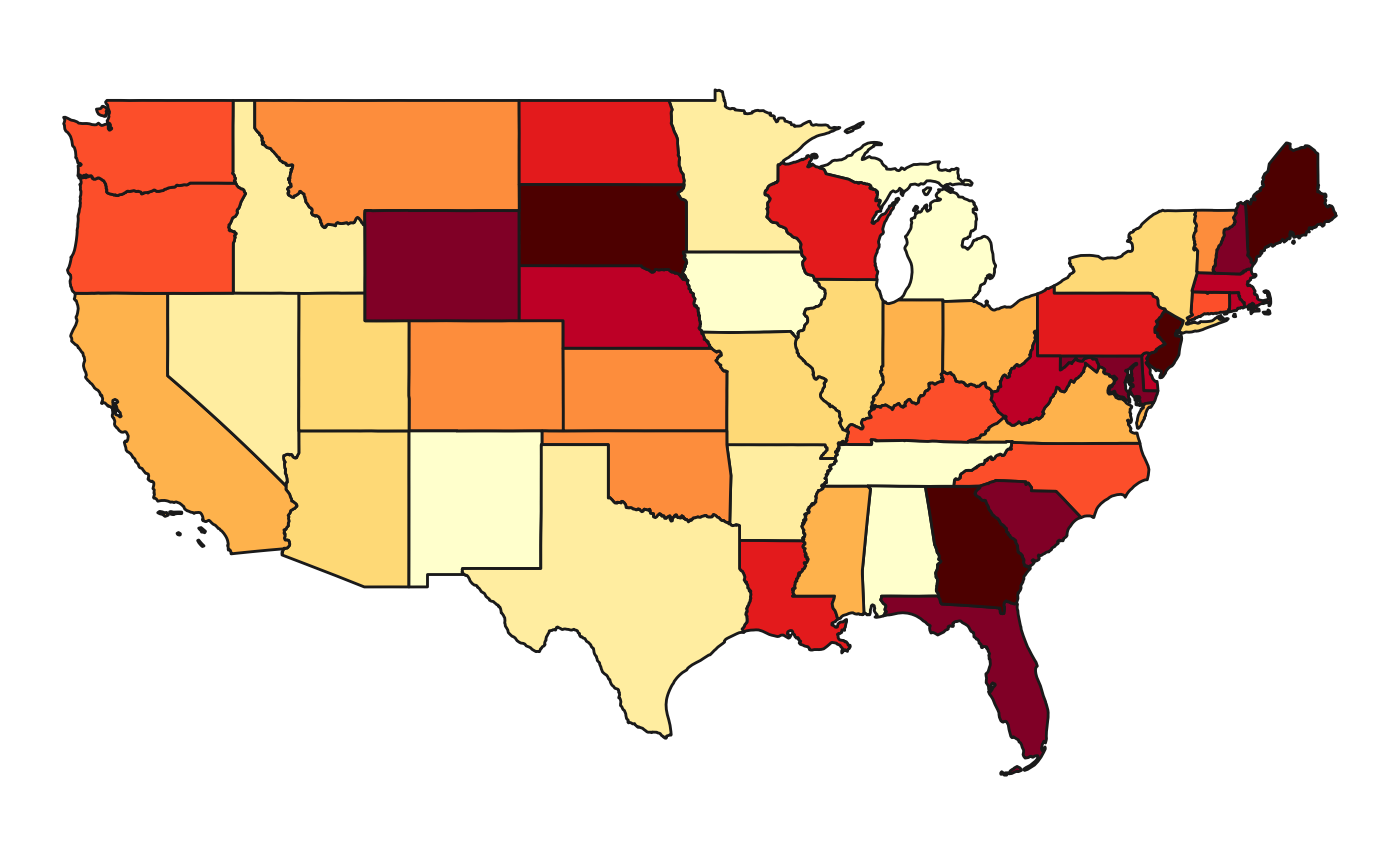
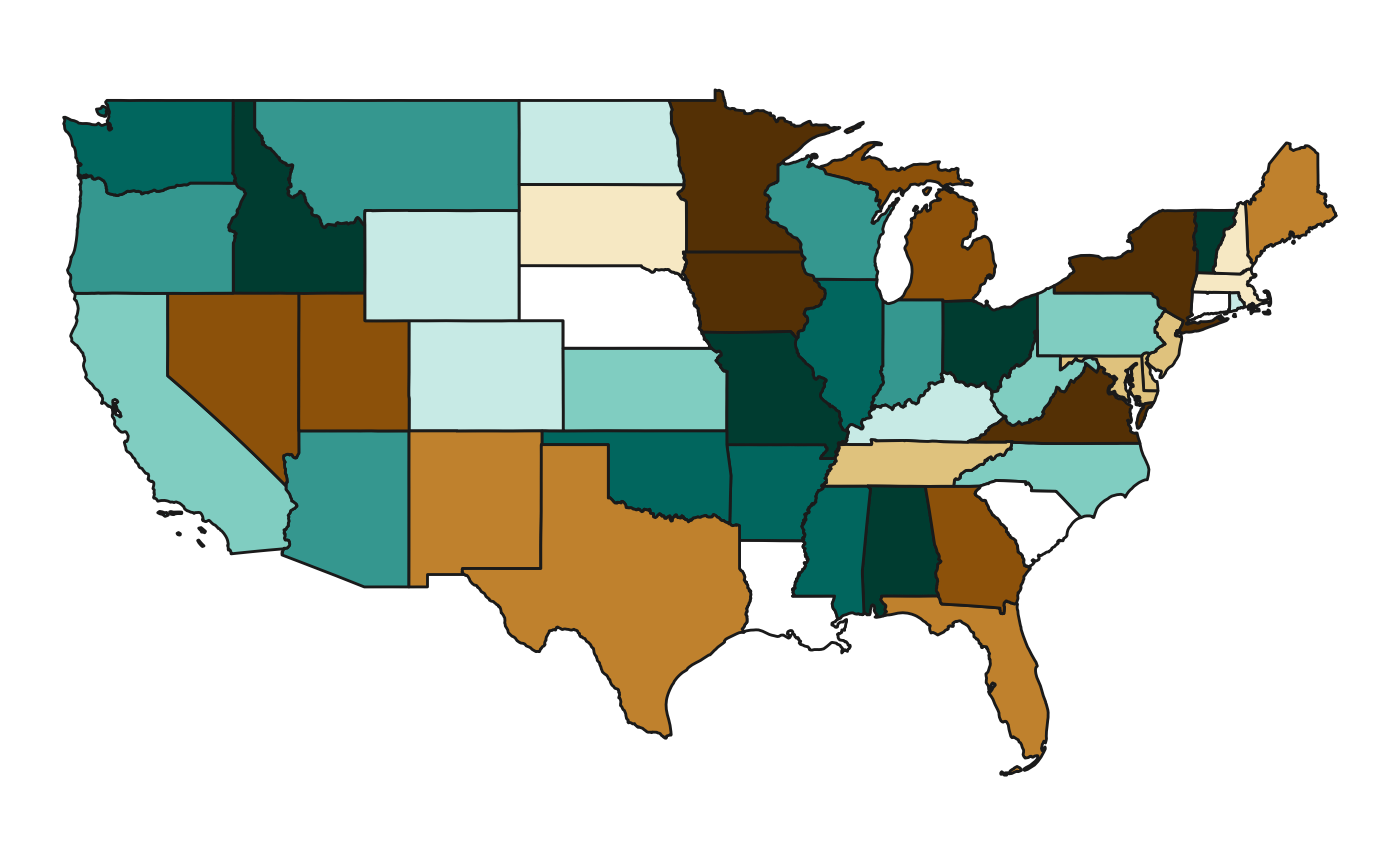
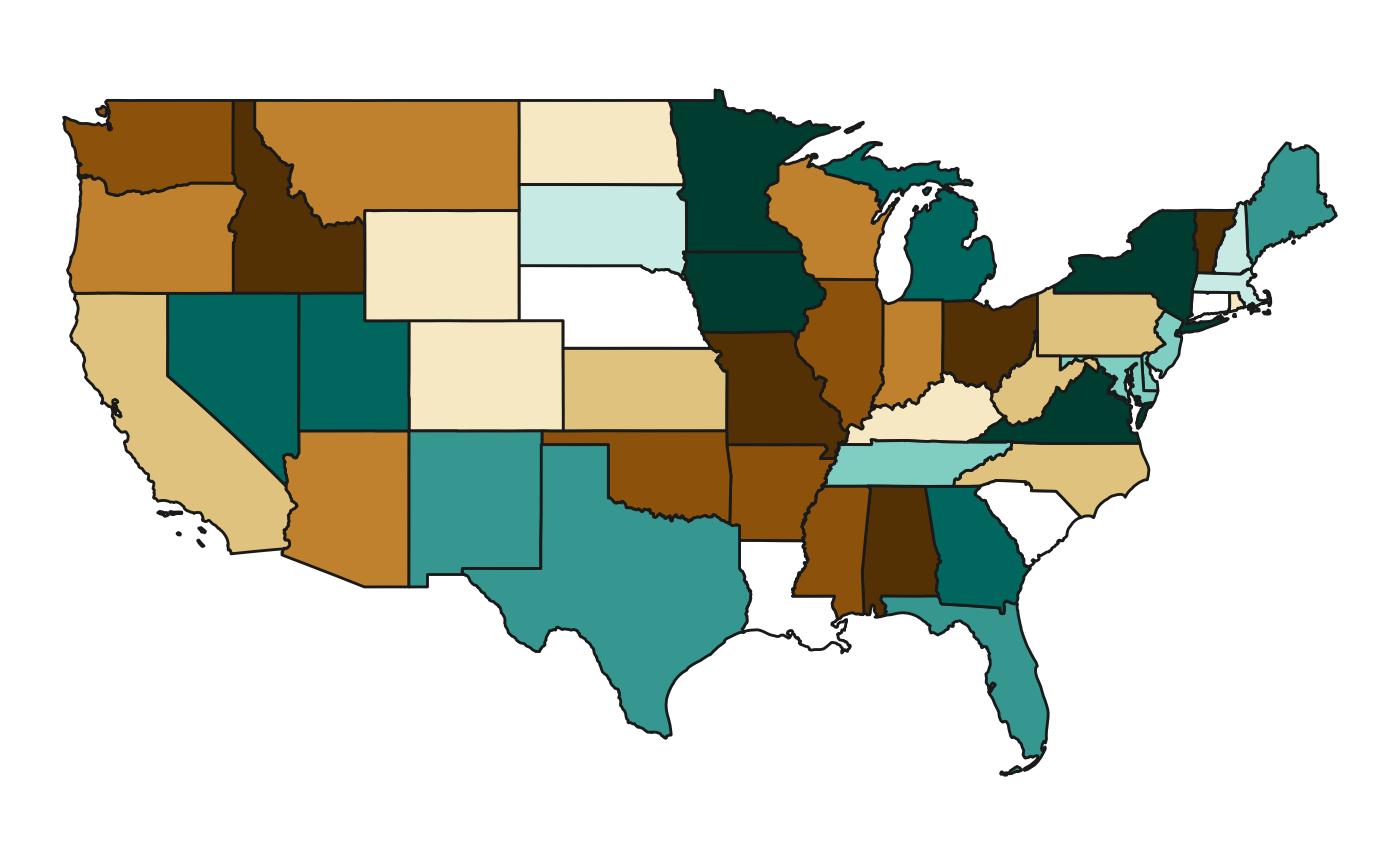
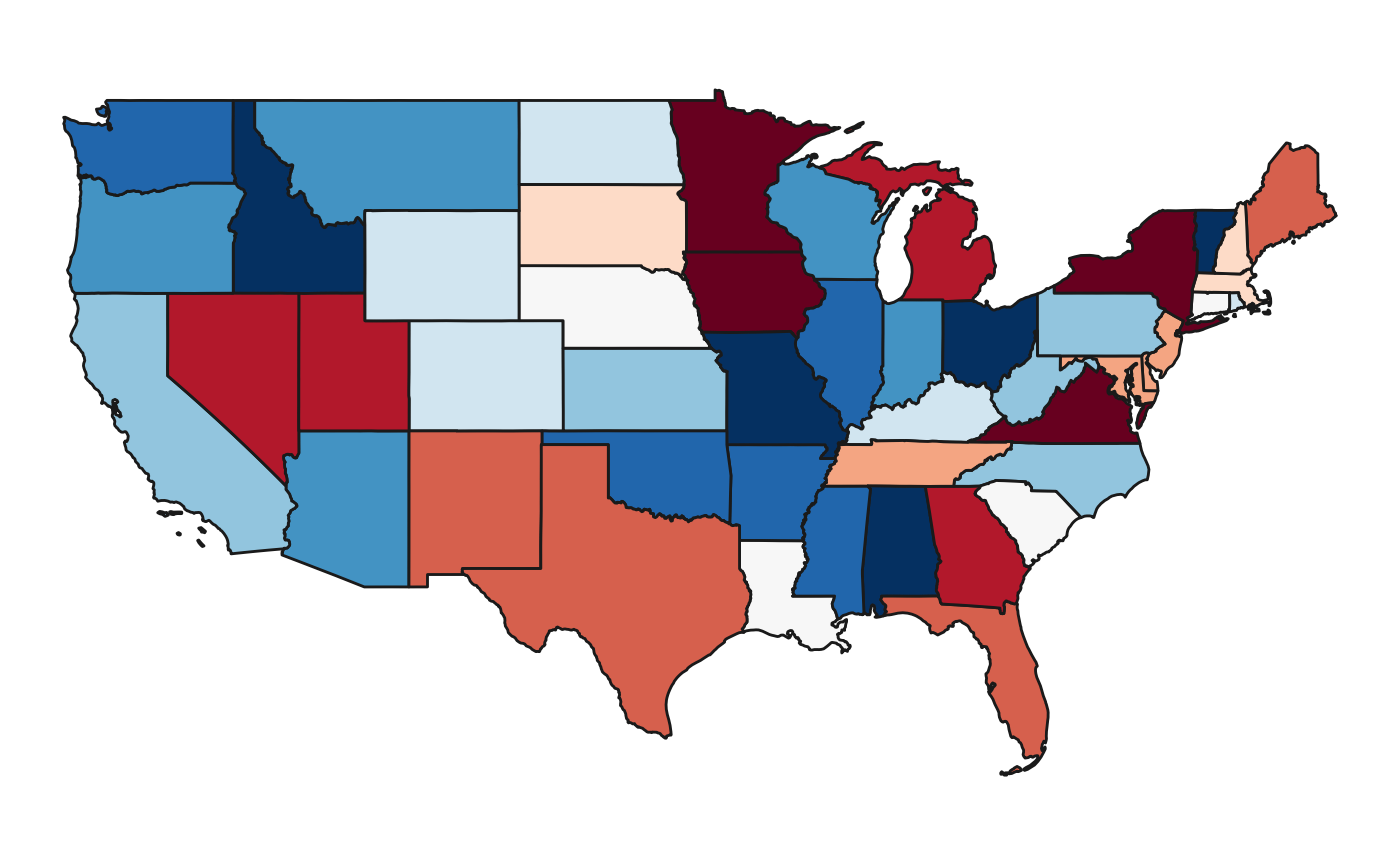
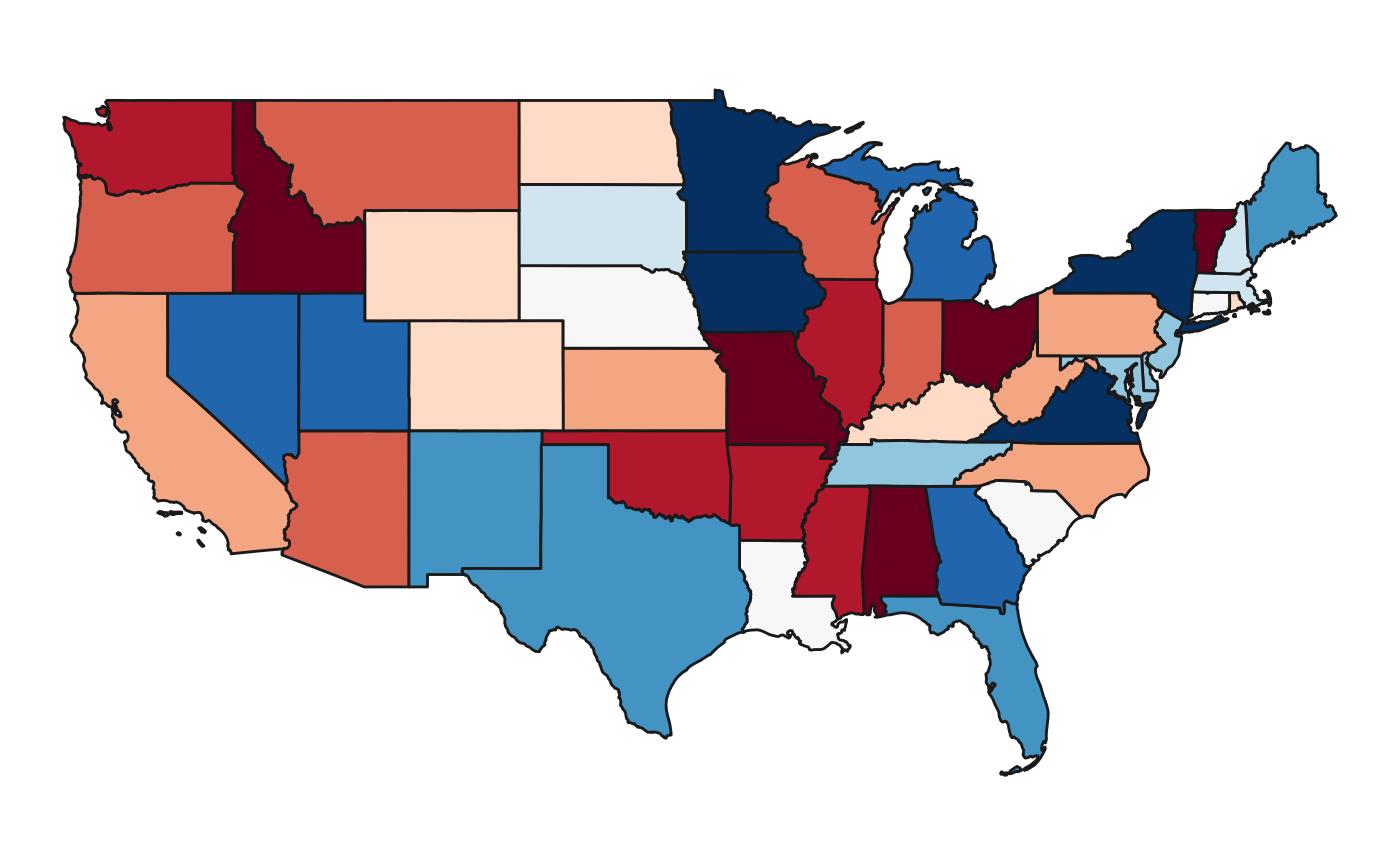
jgcricol("pal_all") is a comprehensive color palette which applies to most JGCRI and GCAM outputs. These can be used for line and bar charts. The following code shows how you can use the same pal_all for various bar charts in ggplot2.
library(jgcricolors)
library(ggplot2)
# Set your palette
mypal = jgcricol()$pal_all
# Example categories for data to plot
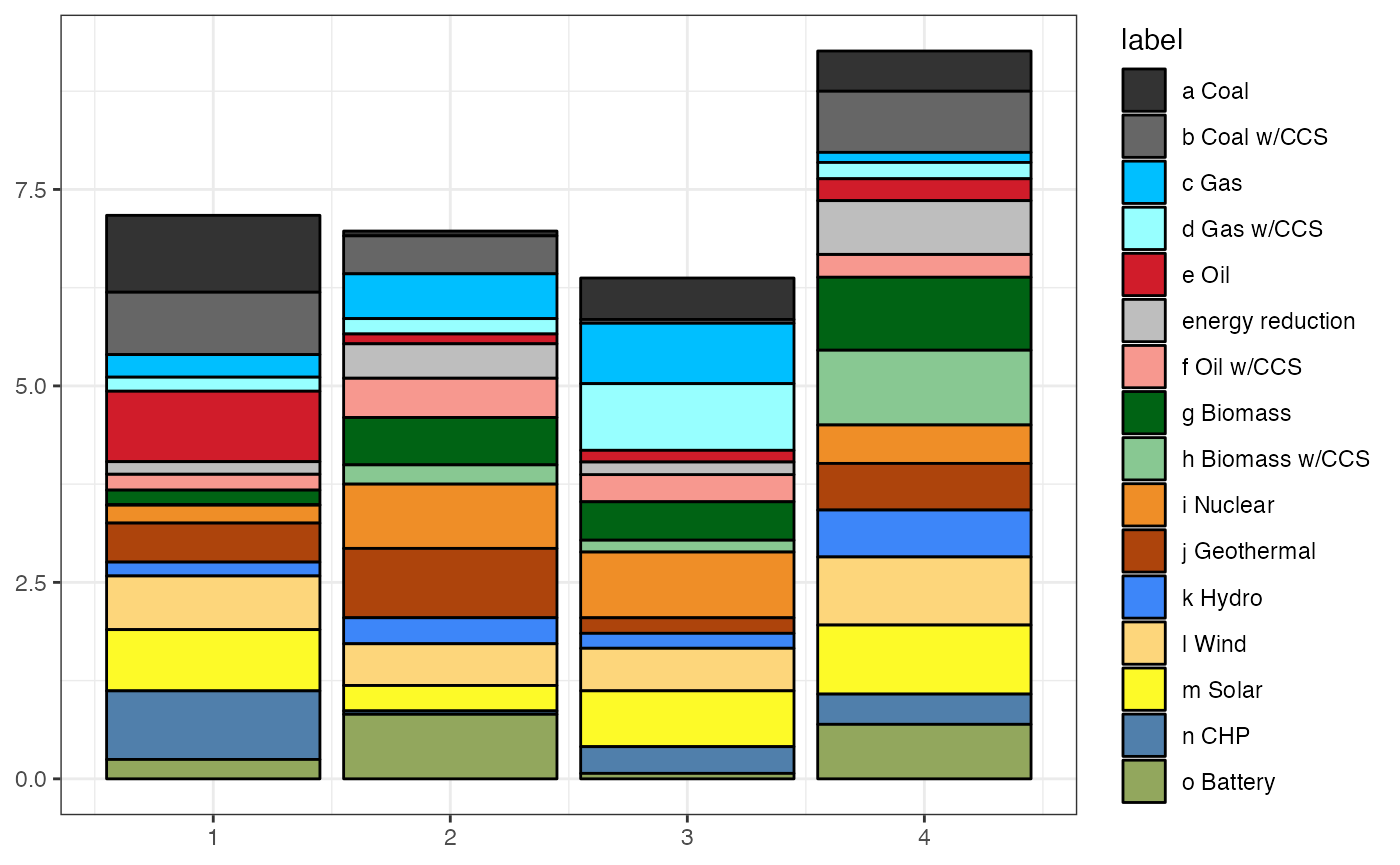
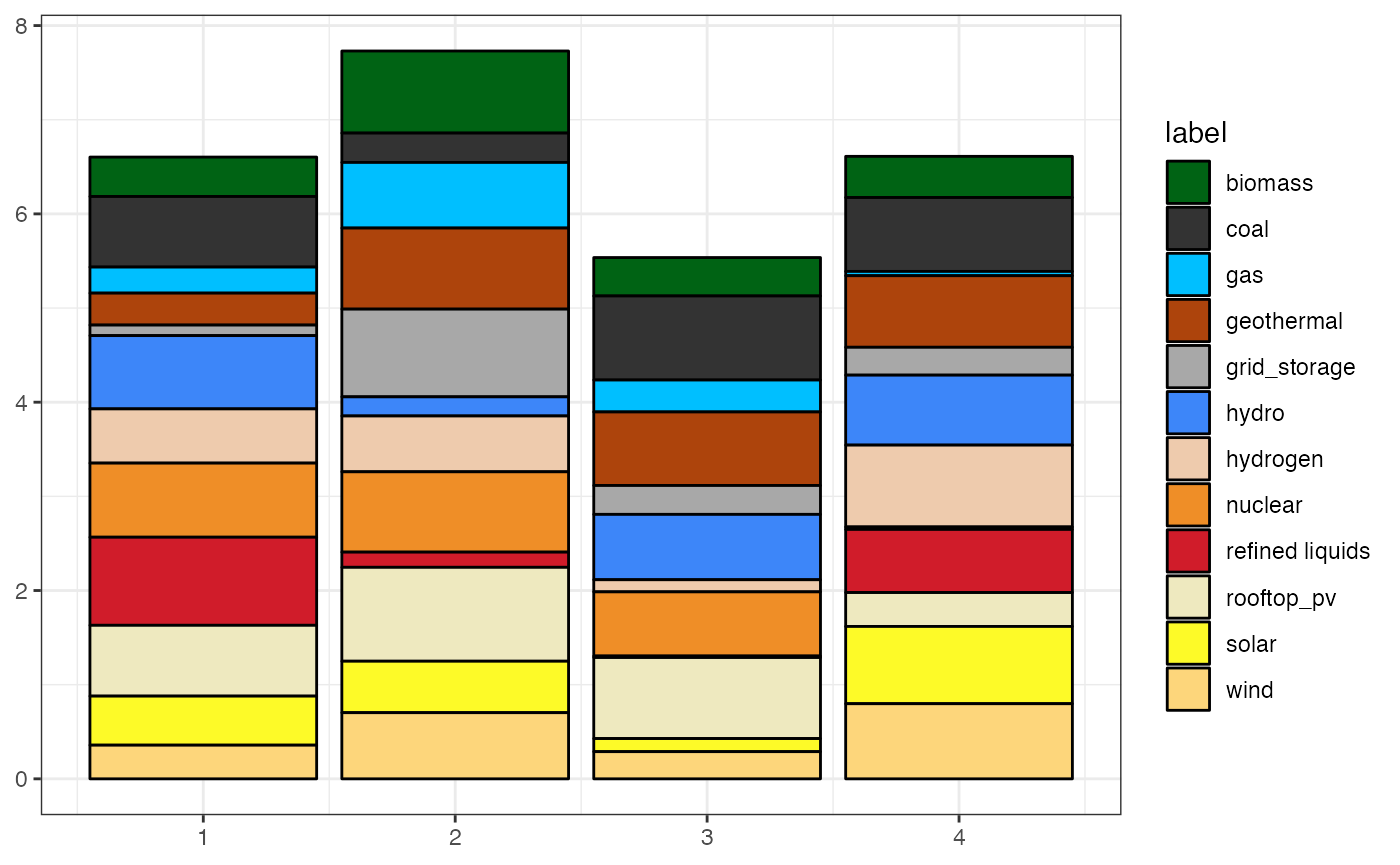
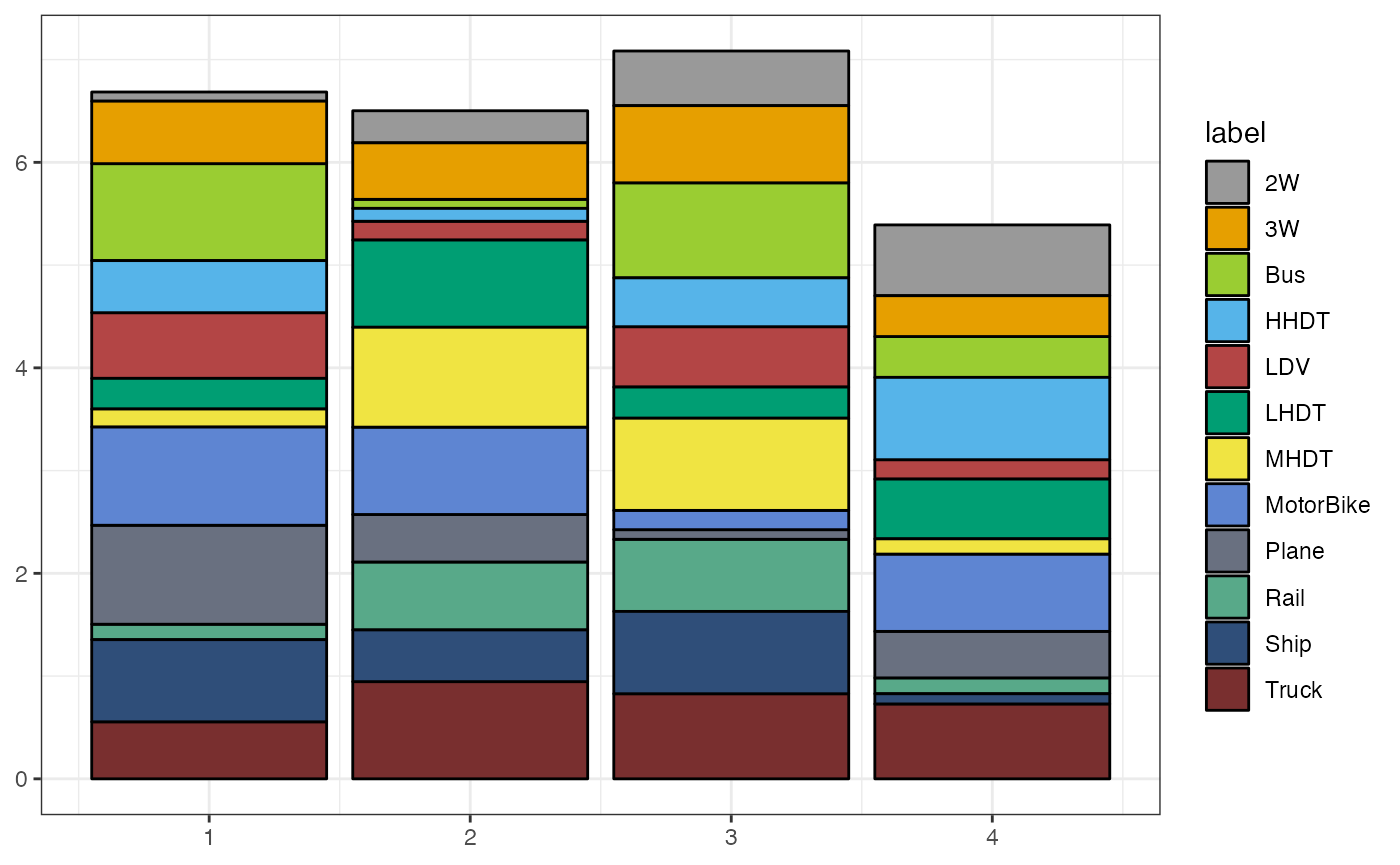
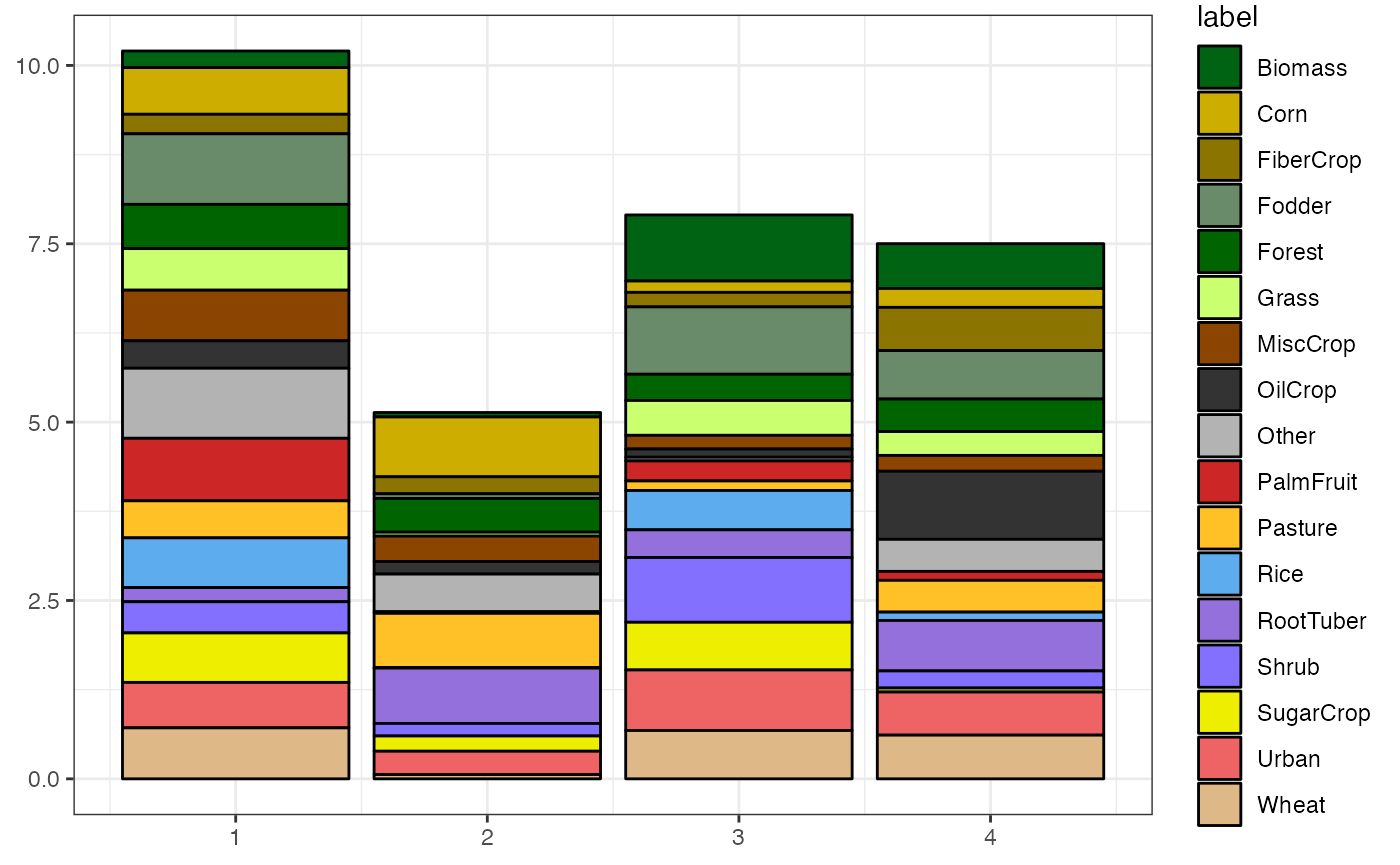
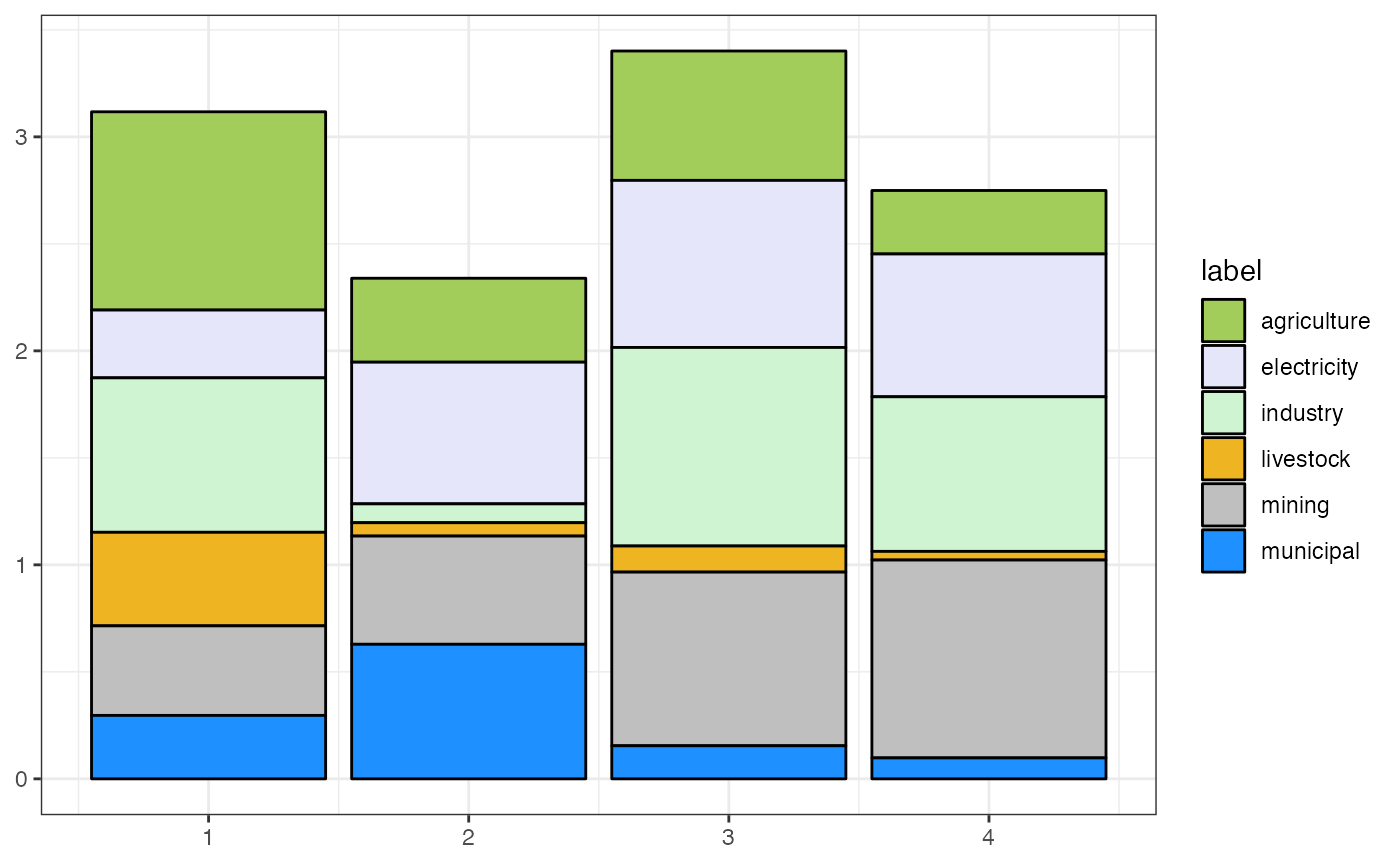
# Can replace these with any other GCAM technologies or classes as done in the subsequent figures.
techs = c("a oil","a oil CCS","b natural gas","b natural gas CCS","c coal","c coal CCS",
"d biomass","d biomass CCS","e nuclear","f hydro","g wind","h solar","i geothermal",
"j traditional biomass","energy reduction")
# Create data
data <- data.frame(label=rep(techs,each=4), x=rep(c(1:4),length(techs)), value=runif(4*length(techs))) %>%
mutate(label=as.factor(label))
# Plot
print(ggplot(data, aes(x=x,y=value, fill=label)) +
geom_bar(position="stack", stat="identity", col="black",lwd=0.5) +
scale_fill_manual(values=mypal[names(mypal) %in% techs]) +
theme_bw() +
xlab(NULL) +
ylab(NULL) +
ggtitle("Primary Energy"))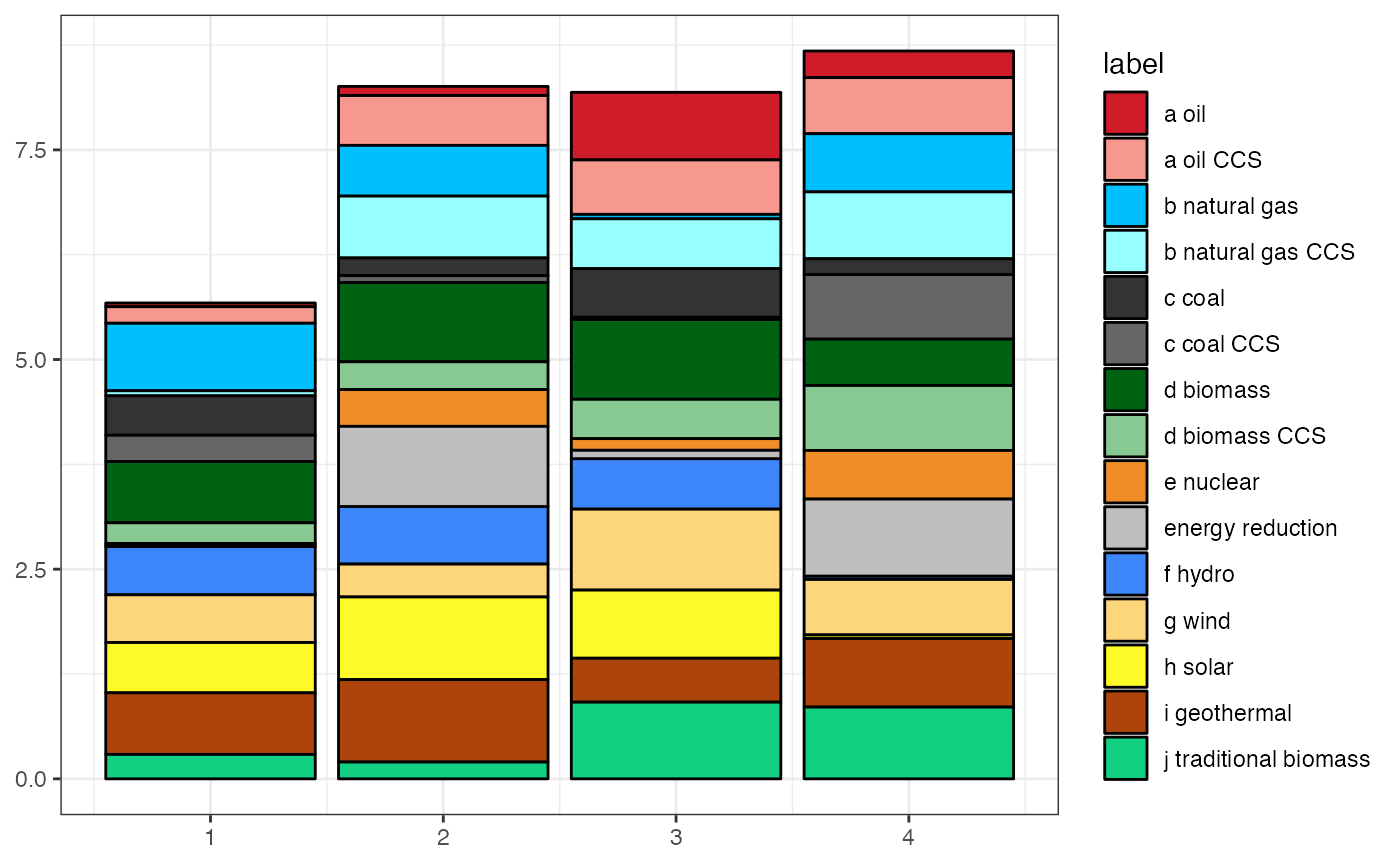
Add Missing Colors
Users can add a color to any jgcricolor palette which may be missing by adding a color from the available R colors or any HEX color and assigning it a name. For example if a user wants to add two new colors for animal energy with the HEX color "#FFF700" and for human energy with the color lawngreen they can do so as follows.
library(jgcricolors)
library(graphics)
mypal1 <- jgcricol()$pal_basic  # To load silently
names(mypal1) <- mypal1
mypal2 = c(mypal1,"animal energy"="#FFF700", "human energy"="lawngreen")
oldpar <- par()
par(mfrow=c(1,2))
par(mai = c(0.5, 0.5, 0.5, 0.5))
pie(rep(1,length(mypal2)),label=names(mypal1),col=mypal1, main="Pal 1 w/ Missing Colors") # Plot as pie chart
pie(rep(1,length(mypal2)),label=names(mypal2),col=mypal2, main="Pal 2 w/ Added Colors") # Plot as pie chart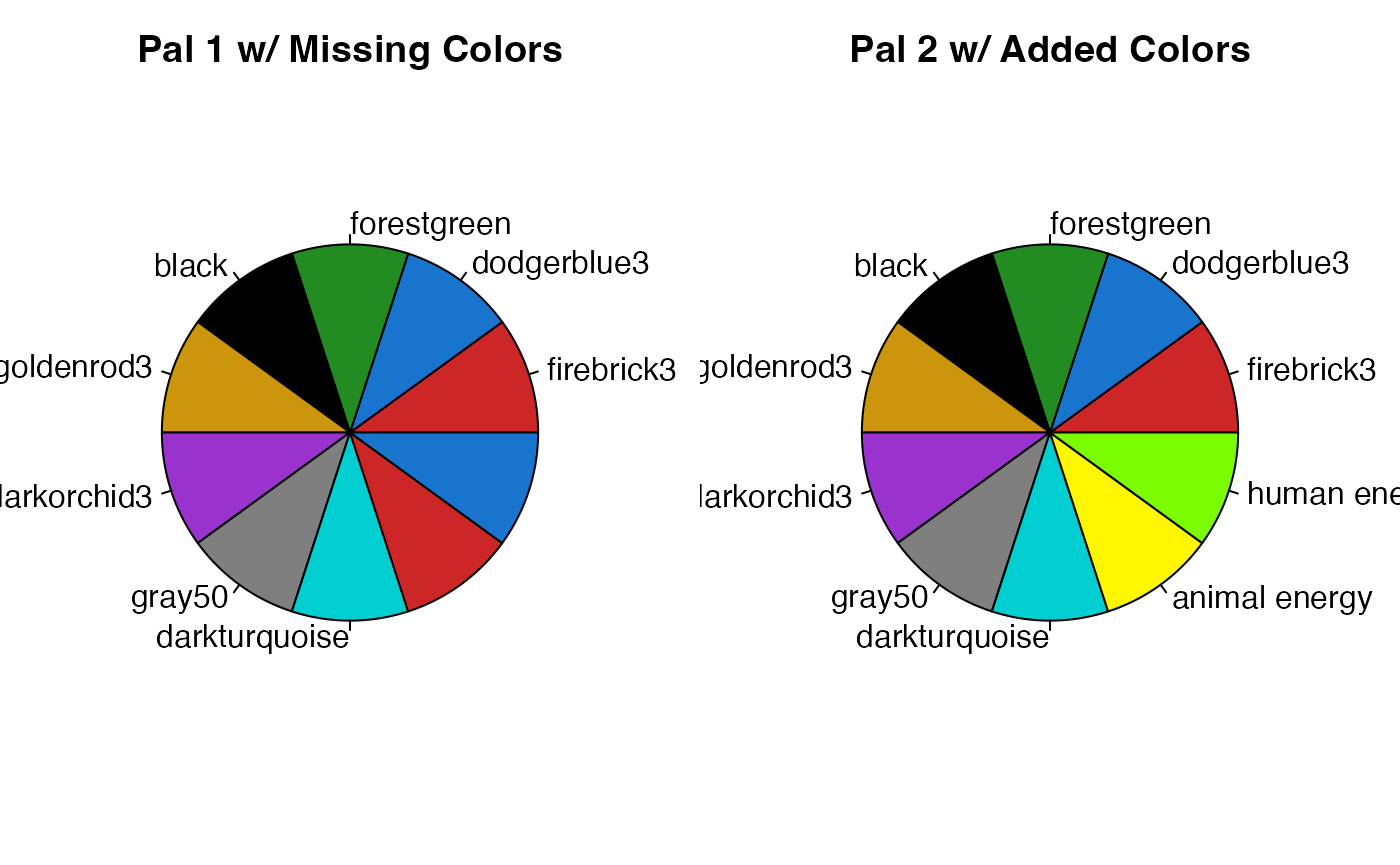
par(oldpar)


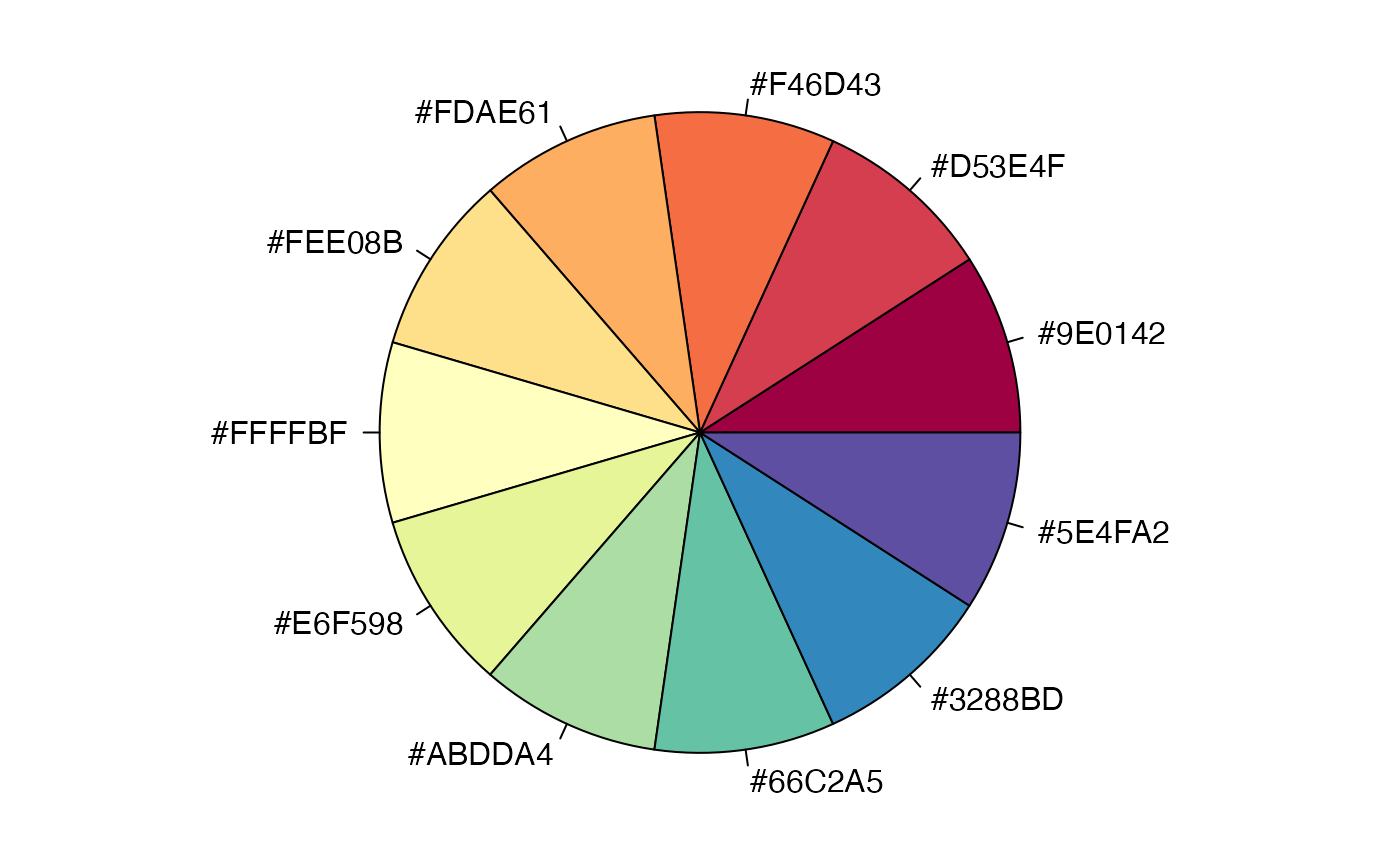
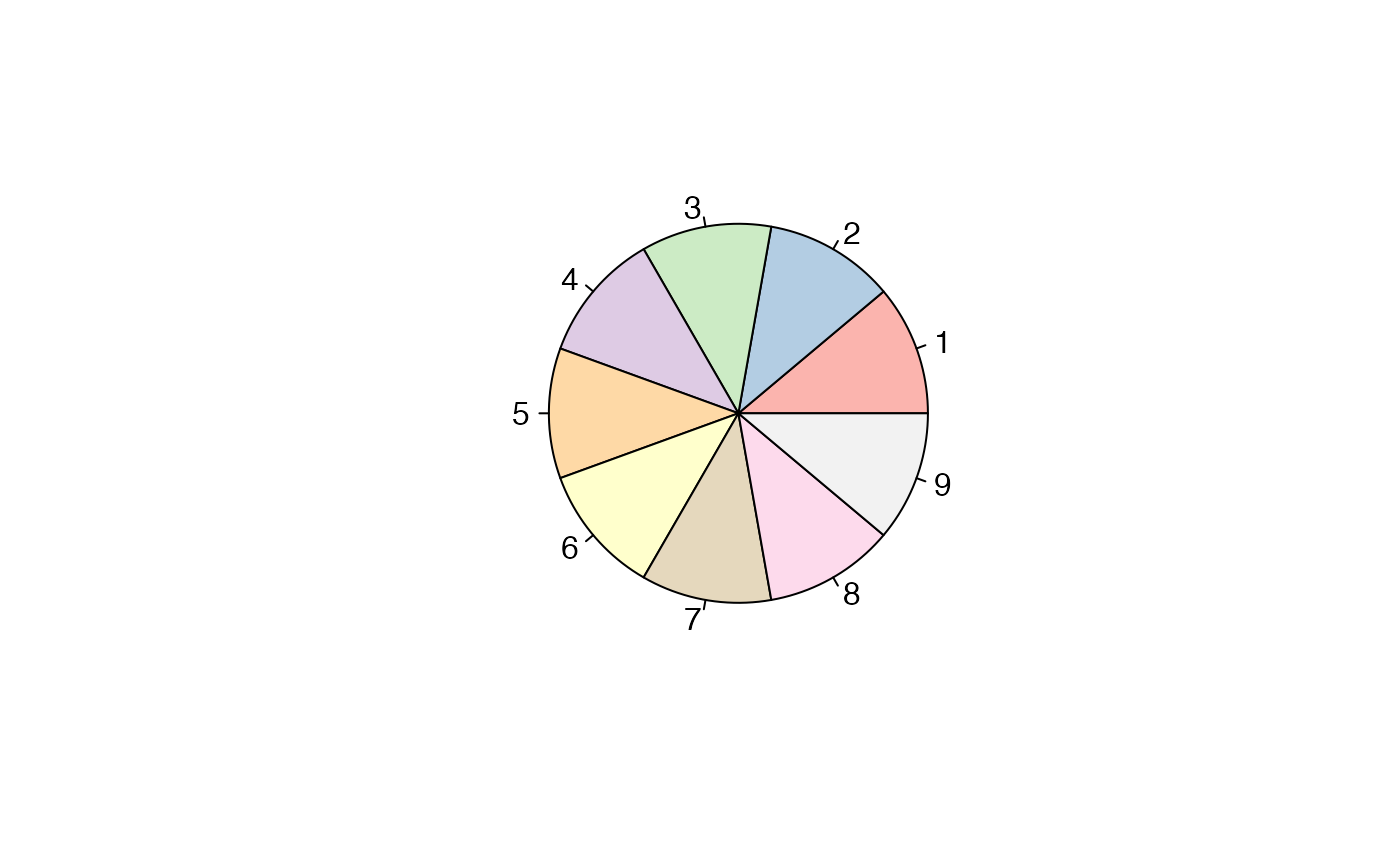
Create custom ramped pallete
Users can create their own ramped palettes of any length n using the RcolorBrewer package and choosing an R palette from the R color palette cheatsheet.
library(RColorBrewer)
library(graphics)
getcol = colorRampPalette(brewer.pal(9, 'Pastel1'));
values=getcol(9);
pie(rep(1,length(values)),label=names(values),col=values)