Getting Started
This page walks you through the steps of installing tethys and running an example. But first:
Motivation
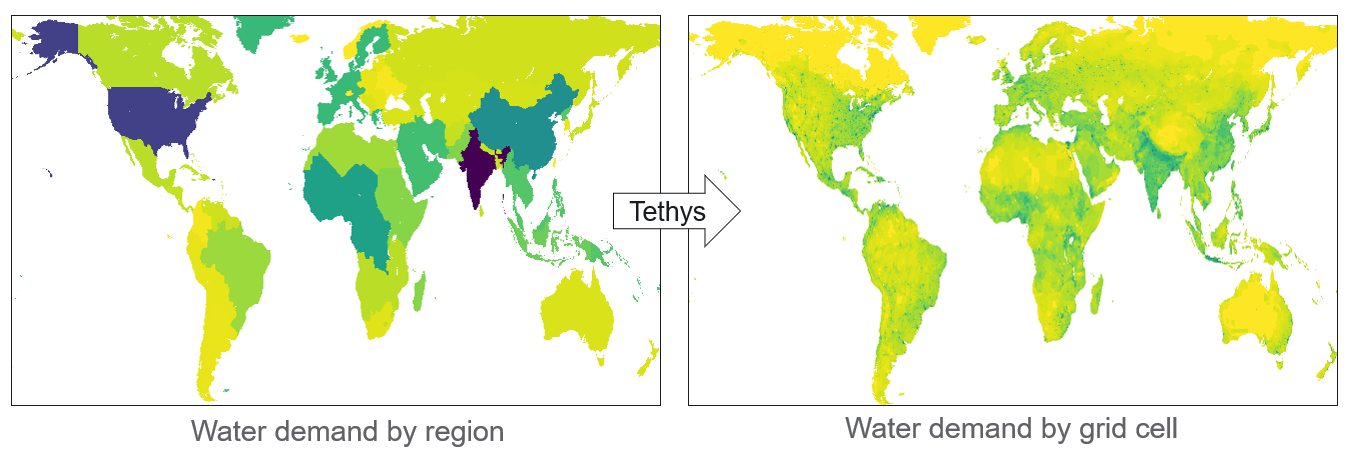
Integrated human-Earth systems models, such as GCAM, can project future water demand at a coarse, regionally-relevant scale by modeling long-term interactions between multiple sectors under a variety of scenarios, while gridded hydrology models simulate physical processes at a much finer spatial and temporal resolution. tethys facilitates coupling between these kinds of models by providing finer-scale water demand data while maintaining consistency with coarser-scale global dynamics.
While tethys is designed to integrate seamlessly with GCAM, it has the ability to downscale region-scale water demand data from other sources as well.
Installation
As a prerequisite, you’ll need to have Python installed (version 3.9 or above), and if you plan on querying a GCAM database, Java must be installed and added to your path.
tethys can be installed using pip:
pip install tethys-downscaling
This will automatically install the dependencies. In order to avoid package version conflicts, consider using a virtual environment.
Try importing tethys to confirm that installation was successful:
import tethys

tethys.__version__  # should print the version number
Example Data
Example data and configurations can be downloaded from Zenodo here, or by using the following:
tethys.get_example_data()
The download decompresses to about 4.5GB. By default, it will make a directory called example at the root of the tethys pacakge, but you can specify another path.
Run
With the example data downloaded, a simple configuration can be run
# assuming you downloaded to the default location
config_file = tethys.default_download_dir + '/example/config_example.yml'

result = tethys.run_model(config_file)
Plotting
tethys makes use of the Xarray package, which provides convenient plotting functionality.
from matplotlib import colors, pyplot as plt

# higher dpi in order to see resolution
plt.figure(figsize=(10, 6), dpi=300)

# powernorm the color palette in order to see more detail at the low end
result.outputs.Municipal.sel(year=2010).plot(norm=colors.PowerNorm(0.25), cmap='viridis_r')

plt.show()
Dashboard
tethys uses Dask for parallelization and to lazily compute results. You can launch the dask distributed client in order to view dashboard and monitor the progress of large workflows.
Note
Viewing the dashboard requires a few other dependencies not automatically installed by tethys. Please ensure your local Java library has been added to your path.
from dask.distributed import Client

# this configuration may need to be different depending on your machine
client = Client(threads_per_worker=8, n_workers=1, processes=False, memory_limit='8GB')

# link to view the dask dashboard in your browser, probably localhost:8787
client.dashboard_link

# run tethys AFTER launching the client
config_file = tethys.default_download_dir + '/example/config_demeter.yml'
result = tethys.run_model(config_file)

# this configuration does not write outputs to a file,
# so plots are lazily computed when requested
result.outputs.Wheat.sel(year=2030).plot(norm=colors.PowerNorm(0.25), cmap='viridis_r')
plt.show()
